The global financial markets appear to have entered a range bound phase based on two basic information sets: comments made by central bankers last week, and how that will effect the two central bank meetings scheduled for next week. The last 24 hours included rate decisions from the Bank of England (BoE), the Swiss National Bank (SNB) and a full slate of economic data from the US, but none of these risk events had much impact on G-7 currency rates.
If there was any market consensus from yesterday’s trading session, it was that the recent US economic data points have been soft enough to keep the FOMC from lifting rates next week, but not weak enough to push the USD Index much below the 30-day moving average at 95.30. The Fed Funds futures are showing less than a 20% probability of the Fed Funds target moving higher after next Wednesday’s FOMC meeting.
Interestingly, the USD/JPY, which makes up 14% of the USD Index price, has also traded down to its 30-day moving average at 101.80 after breaking above near-term resistance at 103.30 on Wednesday. The USD/JPY moved higher on expectations, of more aggressive stimulus measures from the Bank of Japan (BoJ) at their meeting next Wednesday.
However, counter-comments from other BoJ officials about the next policy move show there’s growing splits and indecision within the central bank about which types of stimulus mechanisms could be used, and to what degree. Considering that the primary goal of the BoJ’s open market operations has been to increase growth and inflation, while simultaneously weakening the JPY, their track record this year has been abysmal by every metric.
Recent Japanese inflation data has shown a consistent drift lower over the last five quarters, Industrial production and CAPEX have shown slight ticks higher (albeit from a historically low base) and the USD/JPY has been in a protracted down trend since posting a high of 121.60 in late January. All of this adds up to FX market internal indicators and options pricing showing the lowest expectations of the year that the BoJ can create a positive result.
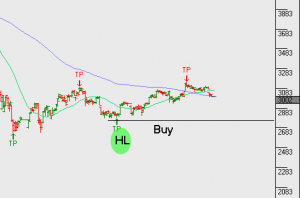
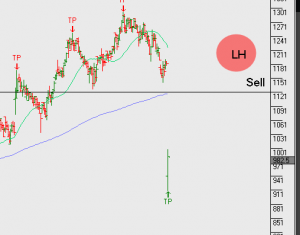
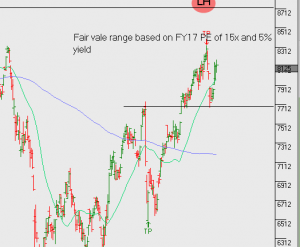
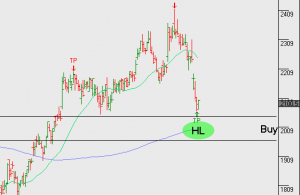
Despite aggressive buying by the BOJ of Japanese listed securities and in particular through ETF’s, the Nikkei 225 has failed to develop a bullish technical pattern. At present, the pressure appears to remain to the downside and it’s only a break through resistance at 17,400 that would change the 12-month old bearish price structure. Both the Hang Seng (Hong Kong) and the Shanghai Composite (china) appear to be breaking-out and outperforming on a relative basis.
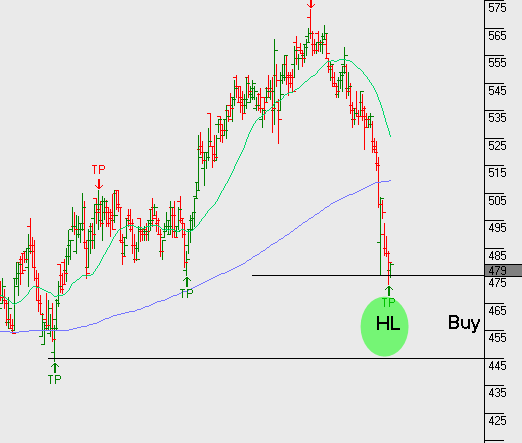
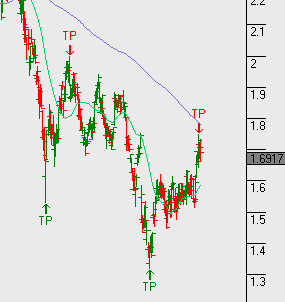
Nikkei 225 Index
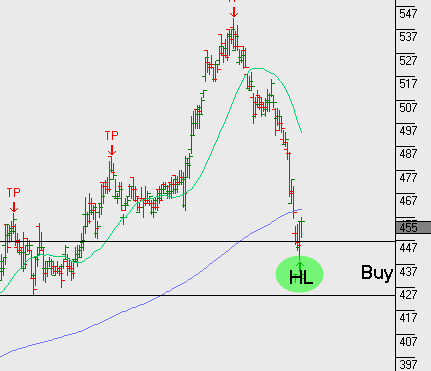
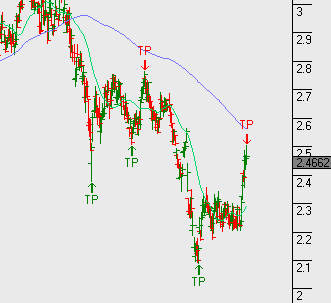
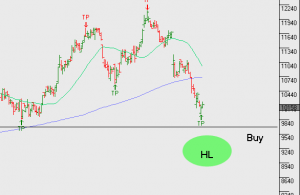
 Hang Seng
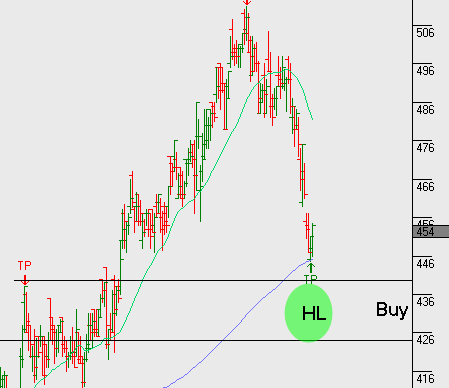
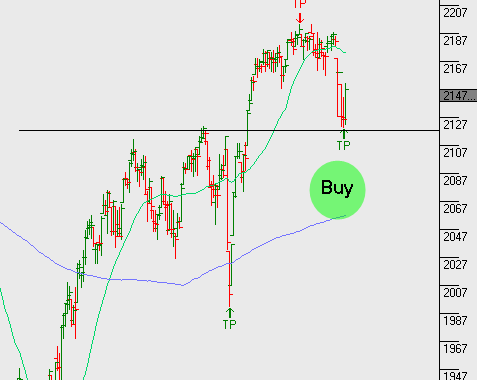
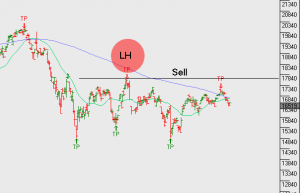
 Shanghai Composite