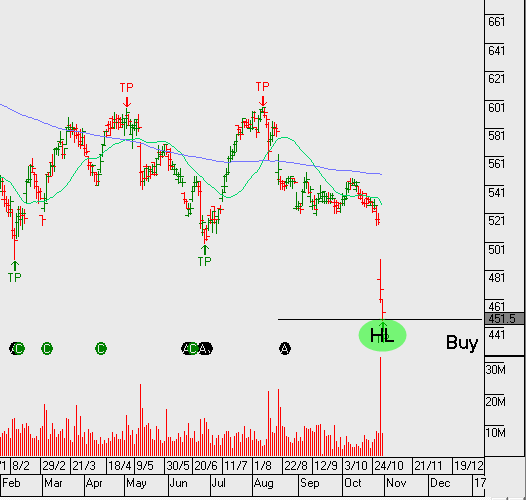
AMP 3Q16 update produced further losses and write downs in life insurance with significant deterioration in Contemporary Wealth Protection.
Going forward, the market is likely to place a greater focus on AMP’s more important wealth management business. AMP is trading on 13x FY17 earnings and now offers a 6% dividend yield.
FY17 net profit should be around $920m on EPS of $0.34 and DPS of $0.28
We’ve been cautious of AMP despite the bullish analyst forecasts over recent time. In last month’s strategy piece we highlighted the relative underperformance to other financial names. This was enough of a warning sign for us not to allocate funds, however, following the sell-off on Friday, we now think value exists in the range of $4.20 to $4.50.
Due to the elevated volatility, we prefer using a spread option strategy to capture the upside whilst quantifying or protecting our downside risk.
A little more than three months ago the citizens of the UK voted to leave the European Union (EU). In the lead-up to the June 24th referendum, many economists predicted an immediate recession and economic chaos on a “Yes” vote.
This sentiment was echoed by then PM David Cameron who said a vote to leave the EU would cause an economic shock that would cost the nation at least 500,000 jobs. This warning, along with UK Treasury predictions of the longer-term damage “Brexit” would cause were the cornerstones to what Brexit supports called “project fear”.
Furthermore, many international institutions — including the Bank of England and the International Monetary Fund — also warned that leaving the EU would have dire economic costs.
However, after yesterday’s stronger-than-expected UK GDP report, project fear now seems like an abjectly partisan political tactic and an economic non-starter.
In fact, the first official growth figures since the Brexit have not only confounded the governments warnings of a recession, but given validation to the few economic pundits who predicted the UK would be better off outside of the EU.
The numbers weren’t stellar, but, according to the Office for National Statistics, the UK economy grew by 0.5% between July and September. The UK Treasury had predicted it would shrink by 0.1%.
And while it’s clear that the Bank of England won’t be removing stimulus anytime soon, it appears that the fundamentals of the UK economy are strong and the GDP data show that the economy is resilient. The internal data in the report reflected an expansion at a rate broadly similar to that seen since 2015 and there’s really little evidence of a pronounced negative effect in the immediate aftermath of the Brexit decision.
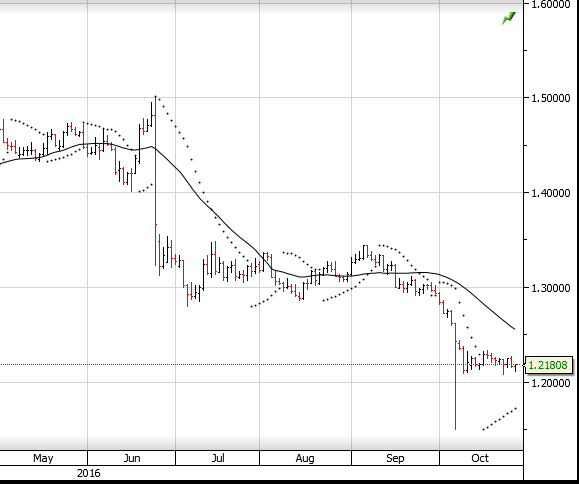
This nascent sense of stability and cautious optimism is best illustrated in the UK Treasury curve. Since bottoming out at .530% in mid-August, the 10-year Gilt yields have more than doubled and have now traded at a six-month high at 1.285% after the GDP data. In addition, over the same period of time, the FTSE 100 index has climbed over 4% from 6750.00 to close to 7,000.00
The question now is: when will the higher UK rates, firmer stock market and stable economic data translate into a stronger Sterling?
In our view, the answer is very soon.
Looking at the daily GBP/USD chart, it’s clear that the “flash crash” on October 7th is still the most dominate technical feature. However, with the market positioning leaning very heavy to the short side, and very little swap benefit in holding short Sterling without downside price momentum, it’s reasonable to expect the risk of a short squeeze is increasing.
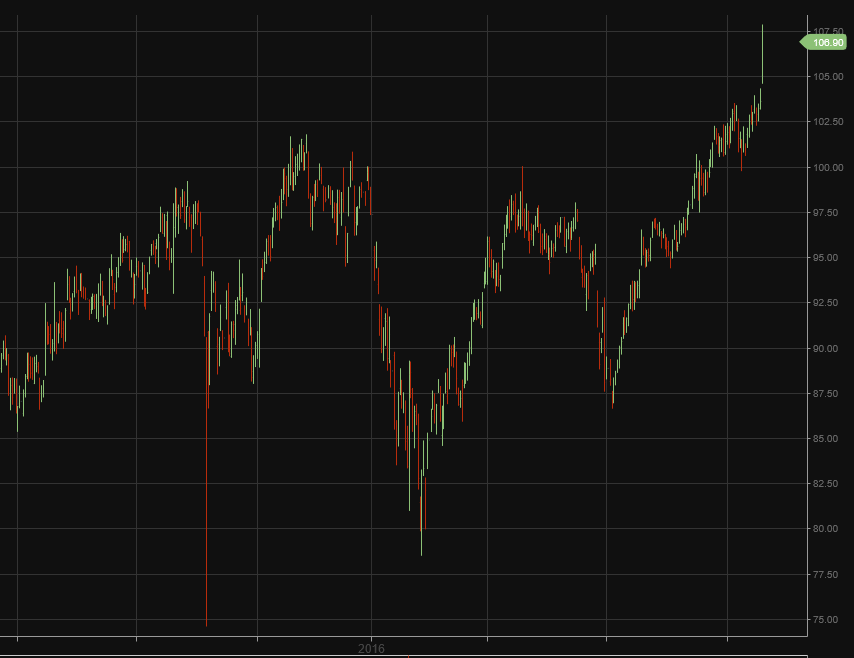
On Friday, MasterCard beat consensus expectations by announcing a Q3 dividend of $1.08 per share on revenue of $2.88 billion on an 18% increase in consumer spending within their network during the reporting period.
Analysts expected the credit provider to report earnings of 98 cents per share on revenue of $2.75 billion. The net revenue number marked a 14% increase over the same period last year.
Shares of MasterCard posted a 3% gain on the day and reached a new all-time high of $107.70 on an intraday basis. As of September 30th, the company announced a total issuance of 2.3 billion MasterCard and Maestro branded cards worldwide.
Despite a 2% fall in earnings for the first half of 2016, Maquarie Group announced an interim dividend of $1.90 per share, up from $1.60 per share in the corresponding period last year and above market estimates for a $1.73 per share dividend.
The investment bank also reaffirmed its guidance for the full year, with expectations of matching the the record $2.06 billion profit it posted in fiscal 2016. For the six months to September 30, the bank recorded earnings of $1.05 billion, down 1.9% from the same period last year but materially better than the forecasts of a drop to $994.5 million.
Macquarie’s tier 1 capital ratio was seen at 10.4% versus 10.7% when it last reported in May, while assets under management rose 3% to $493.1 billion. The modest decline in earnings was driven by an 18% drop in net interest and trading income and a 21% slump in fee and commissions down to $2.2 billion.
As long as the group meets its own forward forecasts that FY 17 will be broadly in line with FY 16 results, the share price valuation will remain reasonable at 12.5X forward earnings for a 5.5% dividend yield.
With around 60% of its total expected income to be earned overseas in H1 17, the company could get a bit of a tailwind if the Australian Dollar continues to track lower versus the US Dollar over the next six months.
Shares of the National Australia Bank (NAB) are pushing back toward the $28.00 level after announcing that its final dividend will be unchanged at 99 cents per share as full-year cash earnings rose 4.2% to $6.48 billion.
Forward guidance suggests a drop in FY17 dividend to 85 cents as bad and doubtful debt charges rose 7.0% to $800 million, expenses rose 2.2% and net interest fell to 1.88%. Based on these figures, the FY17 growth forecast of -1% is the lowest in the sector, which is likely to limit further out performance to peer banks in the near-term.
The forward guidance equates to NAB trading on a P/E multiple of 12x , which is a 6% discount to peers, and a forward yield of 6.2%
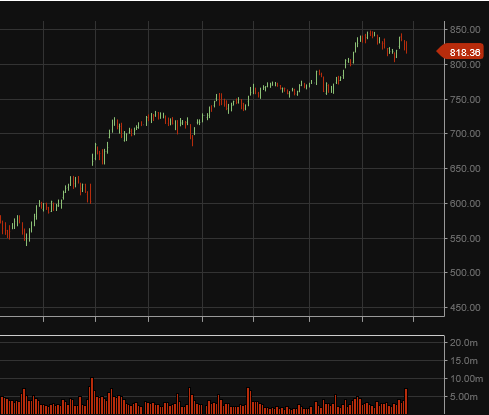
Amazon shares are down over 5% after the company reported earnings below consensus expectations and sales numbers which were barely in line with forecasts.
The e-commerce giant announced it earned $252 million during Q3, or 52 cents per share, compared with 17 cents per share on revenue of $79 million in the third quarter of 2015. Net sales rose 29% to $32.7 billion, compared with $25.4 billion a year ago.
However, analysts had expected the company to report earnings of 77 cents per share on sales of $32.69 billion for Q3.
Comments from chart technicians suggest a key price support level of $810.00 followed by the September low of $765.00
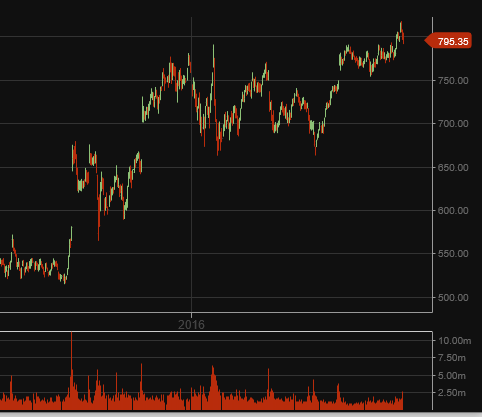
Shares of Alphabet, the parent company of Google, are down over 4% in aftermarket trade even thought the company beat Q3 earnings expectations.
The search engine conglomerate posted Q3 earnings of $9.06 per share, adjusted, on revenue of $22.45 billion. Analysts were expecting the company to report earnings of $8.63 per share on revenue of $22.05 billion.
Today’s results compare to $7.35 per share, with revenue up 20% from last year’s $18.68 billion. The company also announced the approval of a buy-back of over $7 billion of its Class C shares over the next three months.
The share price initially spiked higher, posting a new high for the year at $837.35, before reversing back below $820.00 in after hours trade.
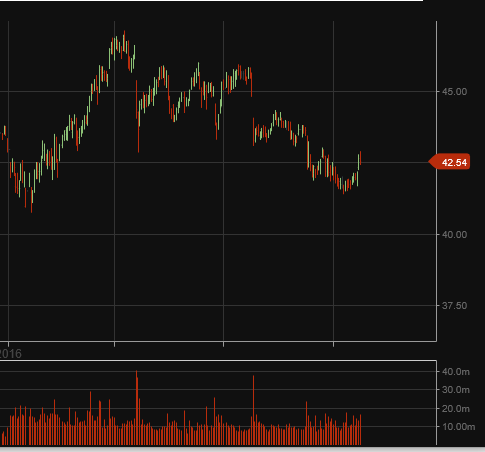
Shares of Coca-Cola dropped slightly to 42.50 on weaker year-on-year profit guidance even though Q3 earnings were slightly higher.
The beverage maker announced a profit of $1.05 billion, or 24 cents per share, down from $1.45 billion, or 33 cents per share in Q3 2015. Excluding one-off tax items, per share earnings were 49 cents per share, while revenue declined 6.9% to $10.63 billion.
Analysts had forecast adjusted earnings of 40 cents on revenue of $10.51 billion. It was the seventh straight quarter that the firm beat expectations; if only slightly. However, when announcing their 2017 guidance, the company warned of a potential 4% to 7% decline in comparable earnings over the medium-term.
This negative guidance gives scope for a pullback in the share price to the $40.00 area last seen in January of this year.
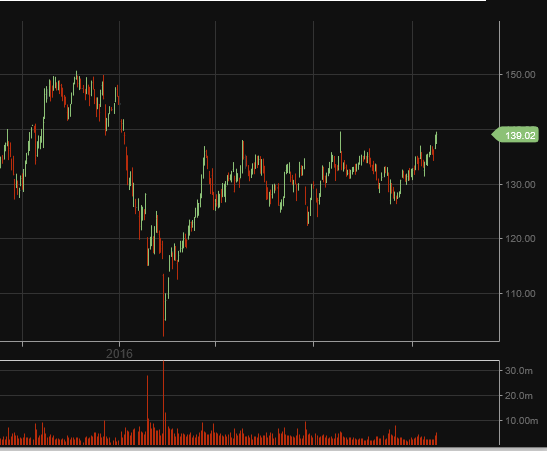
Boeing shares jumped over 4% to post a new high for the year at $148.00 as the company beat expectations for Q3 earnings.
Despite a decline in revenue, the aircraft manufacturer said earnings rose to $2.28 billion, or $3.60 per share, from $1.70 billion, or $2.47 per share during Q3 2015. Core earnings, which exclude some pension and other costs, rose to $3.51 per share from $2.52 a year ago.
Both figures include a special gain of 70 cents per share, reflecting a tax benefit Boeing received by claiming depreciation on plants and equipment.
Positive forward guidance brought in longer term buyers as the company raised its target for jetliner deliveries for the year to 750 from 740 and lifted its year-end revenue estimate to 95.5 billion from 93.5 billion.
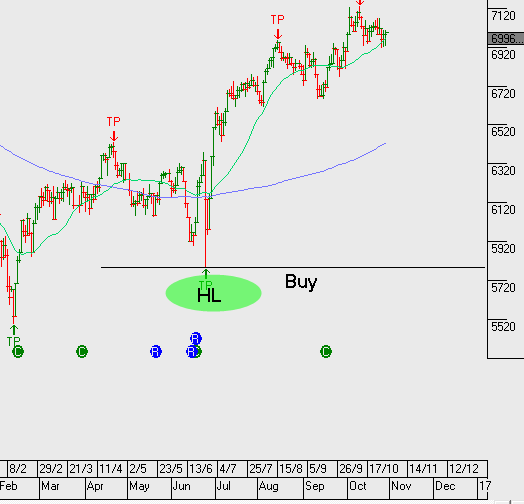
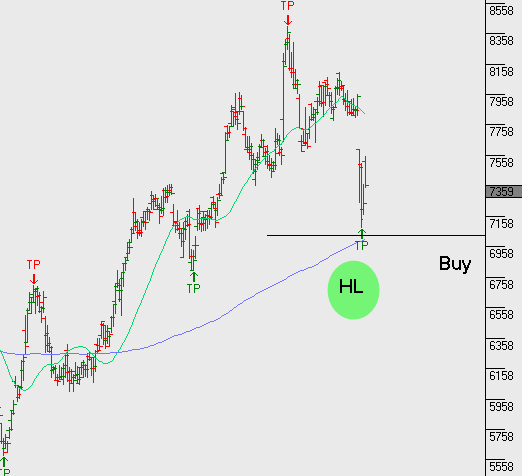
Ramsay 1Q17 earnings results were in line with market expectations and the company reaffirmed core NPAT and EPS growth should be in the range of 10-12% for FY17.
RHC.ASX should start to build support at or near $70, upside is limited and covered calls should be used to enhance the yield.
Chart – Ramsey
Send our ASX Research to your Inbox
Or start a free thirty day trial for our full service, which includes our ASX Research.