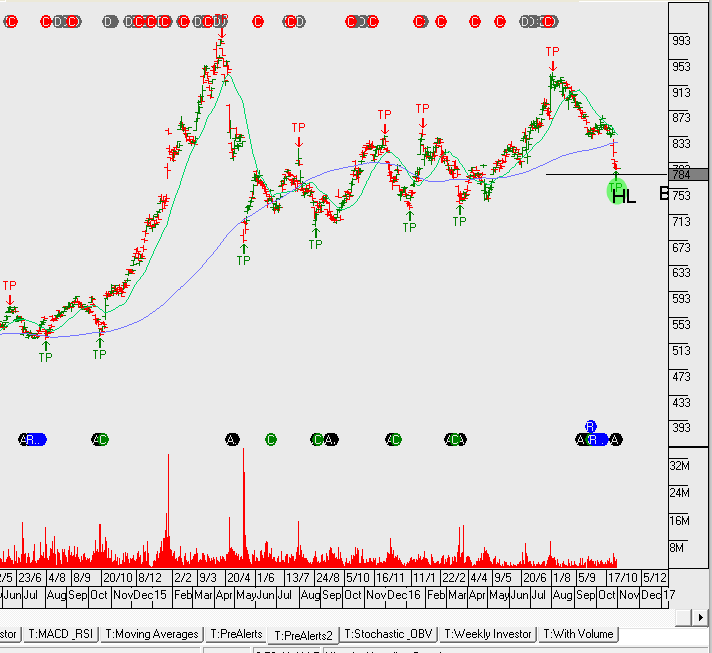
Resmed reported 1Q17 results with adjusted NPAT of $88 million or 3.6% growth on the same time last year.
While the improving gross margin is a positive sign, it’s difficult to equate RMD’s 3% organic growth in the first quarter with its recent FY17 multiple of 22x earnings. The recent pull back in the share price to $7.85 could relieve some of this P/E imbalance.
We look to add to the RMD position on the current pullback. A rally back above $8.25 will provide an opportunity to sell covered calls.
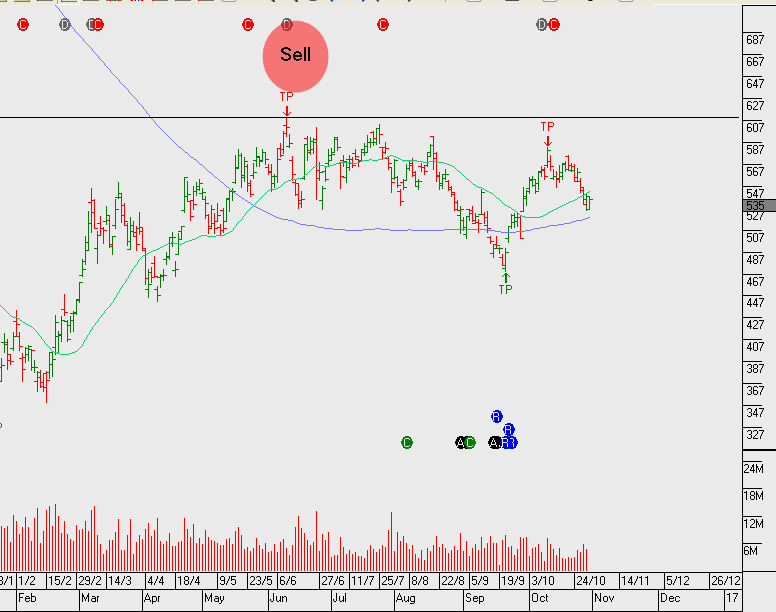
Origin production numbers in the recent quarter displayed some encouraging progress within the LNG business unit. Production volumes increased 8% quarter on quarter and upstream revenue increased 32%.
APLNG T1 continues to operate above nameplate capacity & T2 has now started.
ORG’s balance sheet remains under pressure with $9.1b in debt, although the company is ahead of market guidance with respect to managing the reduction of debt.
ORG should continue to benefit from its diversified exposure to energy markets. FY17 outlook is for revenue of $12b, net profit of $550m with gearing at 50% and no dividend. FY18 we see a slight improvement in revenue and net profit increasing to $800m and the likely announcement of a return to paying $0.25 per share in dividends. This places the stock on an FY18 yield of 5%.
Origin has options available to unlock shareholder value. We may see a split of their retail division which will open potential acquisition options for Woodside (or others) to consider the Origin LNG assets as an example.
Over the last six months, an overarching theme driving G-10 financial markets has been the divergence in interest rate policy trajectory between the US Federal Reserve and the rest of the group. From a “cause and effect” point of view, US economic data has been viewed through a prism of how it could influence policy decisions from the FOMC, which has then impacted the way G-10 assets respond relative to US assets.
In short, key fundamental data points which print better than expected have been bullish for the USD and bond yields, and economic reports which reflect weakness in the US have been bearish for the USD and bullish for US stocks. However, last Friday’s trading session illustrated how these correlations will likely be suspended until after the US Presidential election on November 8th.
Friday’s NY trading session began with the release of the highest Advanced GDP report in two years. As expected, the USD Index rallied to a 9-month high just under 99.00 and the EUR/USD slipped to the low end of the range near 1.0850. At around 1:00 PM, NY time, news hit the wire that the FBI said it would reopen its investigation into Hillary Clinton’s private e-mail server after new evidence was discovered on other electronic devices in an unrelated case. The market acted swiftly as the EUR/USD jumped 90 points, bond yields fell and the SP 500 dropped 20 handles from 2140 to 2120 before recovering.
We won’t discuss the validity of the FBI’s decision. However, from a market participants point of view, the important thing to note is that anytime there’s an opening for Don Trump to close the polling gap it means more uncertainty on the horizon and less chance of a rate adjustment this December from the FOMC. As such, we will offer to explain some of the dynamics we could be up against over the next several trading sessions.
It seems the market’s fear of a Trump victory is focused on his proposed tax cuts leading to higher deficits and a steeper yield curve. Some other analysts believe his trade policies could trigger a sell-off in equities and a flight to quality into the long-end of US Treasuries.
Using the “Brexit” vote as a point of reference, a Trump win could trigger a sharp rise in volatility in bonds, FX and equities. And while the spike in asset volatility was short-lived as the VIX moved back to pre-Brexit levels by early July, the impact on the yield curve lasted much longer. The UK referendum was on June 23rd, and it took until mid-September for the UK 10-year Gilt yields to rise above their pre-Brexit levels. There is a similar fear in the US Treasury market if Don trump wins.
In this respect, it’s our view that this week’s fundamental news (which includes 3 Central bank meetings and European PMI’s) will take a back seat to the re-pricing of last week’s forgone conclusion that Hillary Clinton will win the US election.
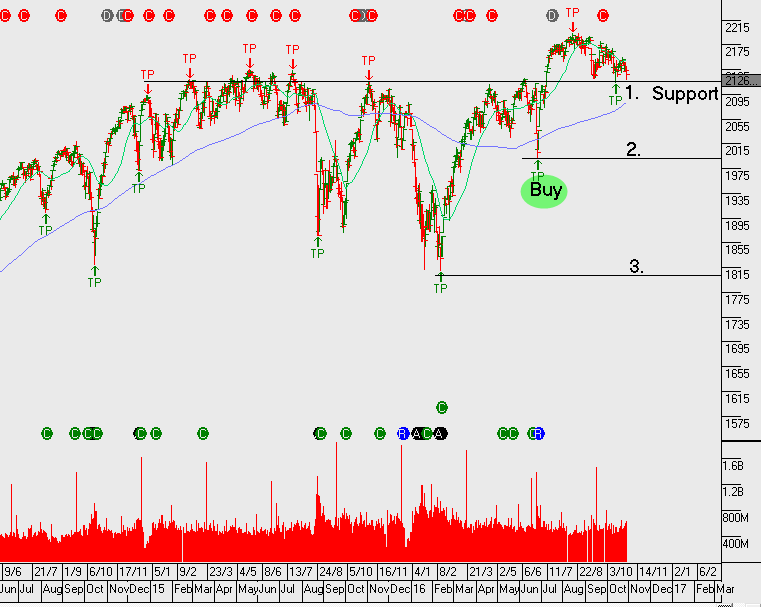
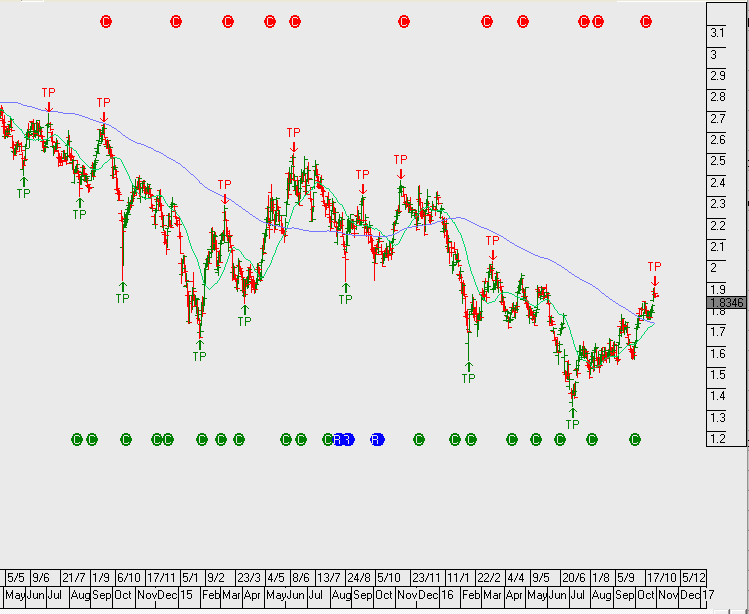
Chart – S&P500 IndexChart – US10 YR Bond
Send our ASX Research to your Inbox
Or start a free thirty day trial for our full service, which includes our ASX Research.