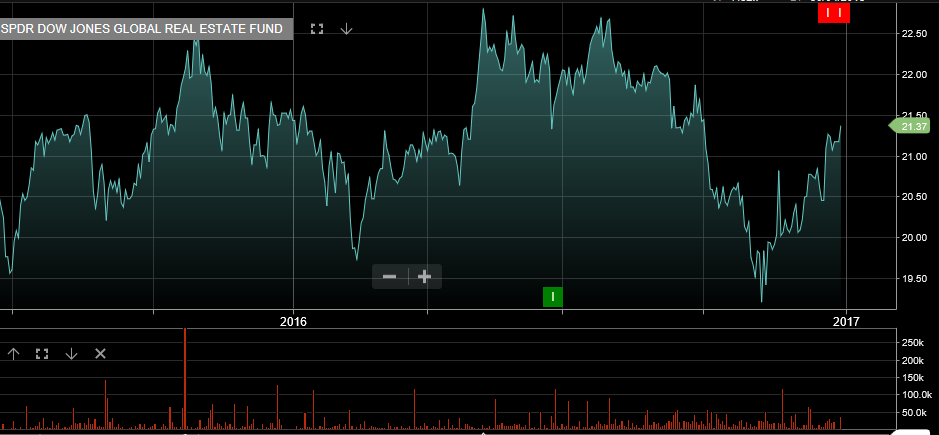
The Algo Engine has triggered a short signal in the ASX listed SPDR Dow Jones Global Real Estate Fund. We’re being alerted to the change in structural trend and the potential that we’re in a counter trend bounce. To align this technical picture with fundamental analysis it’s most likely that a trigger for a sell-off in yield sensitive names, (such as property trusts), needs further upside in US bond yields to generate the tipping point.
We struggle with the timing of the above alert, as our base case for markets is that US yields are topping out short term and not moving higher. Therefore, not providing the catalyst needed to go short yield sensitive names.
Domestically, many of our REIT’S also display a very similar technical picture to the below chart. Our preference from an asset allocation perspective is to use the current short signals in yield sensitive names as a timing tool to sell at-the-money calls.
Going into 2017, one of the biggest decisions investors face is what portfolio weighting to allocate to Australian banks.
Over the past three years, the Australian banking sector has grown to represent over 30% of the ASX 100 capitalization.
This growth has been supported by record bank profits, weakness in other sectors and the chase for yield by offshore investors as central banks in Europe, Japan and the USA have pushed interest rates to historically low levels.
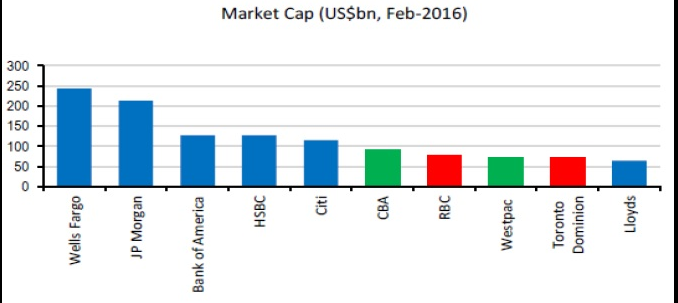
This has contributed to all four of Australia’s primary banks now being in the top 15 global banks by market capitalization, despite their relatively small footprint in the global financial system. In fact, as of February 2016, both CBA and Westpac were listed in the top 10 global banks in terms of market capitalization.
Over the past five years, Australian banks have been very successful in generating profits from their domestic branches which operate in a snug banking oligopoly. Competition from non-bank lenders hasn’t increased materially in the mortgage area and bad debts remain at manageable levels.
Nevertheless, Australian banking shares (while offering high dividend yields) are likely to face a fairly constrained pricing environment and higher loan losses, should the domestic economy continue to slow in 2017.
It’s been reported that international fund managers have been systematically, shorting Australian banks based on the belief that the domestic housing market is overvalued and primed for the same dramatic decline which occurred in Ireland, Spain and the USA over the last 10 years.
Furthermore, a growing number of analysts are suggesting that protracted weakness in the local economy will burst the housing bubble, contributing to the Government losing its AAA credit rating and putting downward pressure on Australian bank share prices throughout 2017.
Our base case is not quite that grim. However, we do expect to see limited upside to the share prices of the big four banks from current levels and eventual rotation into healthcare companies and yield names.
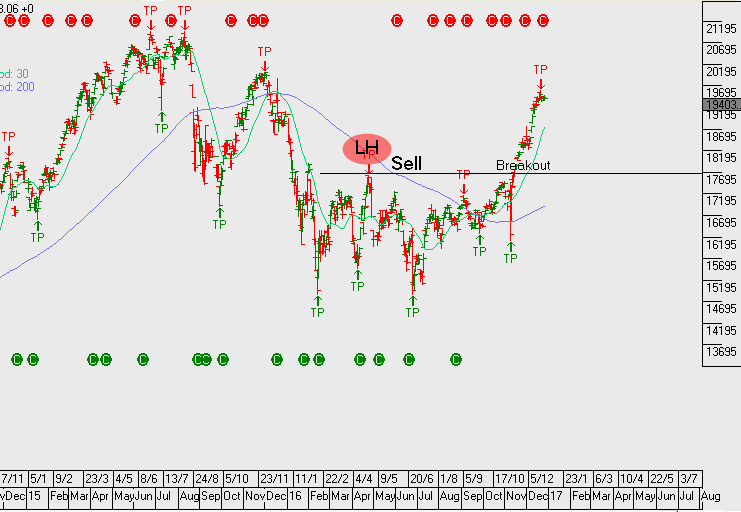
From a technical perspective, we expect to see price resistance for the four major banks around the following levels: WBC $33.50, CBA $86.00, ANZ $32.50, NAB $32.00.
Flash points for the global equity markets in 2017 remain Italian Banks, Chinese Economy & uncertainty around Trump presidency.
Japan continues to struggle to shake off deflationary pressures as the November consumer price index fell for the ninth straight month. Bank of Japan Governor,Haruhiko Kuroda rejected claims the BOJ’s yield curve control and 2% inflation target may be too ambitious and that the central bank has room for more economic stimulus.
China’s 6.5% economic growth target may not be maintained, especially if it continues to compound the rising debt issues the country faces and creates too much risk.
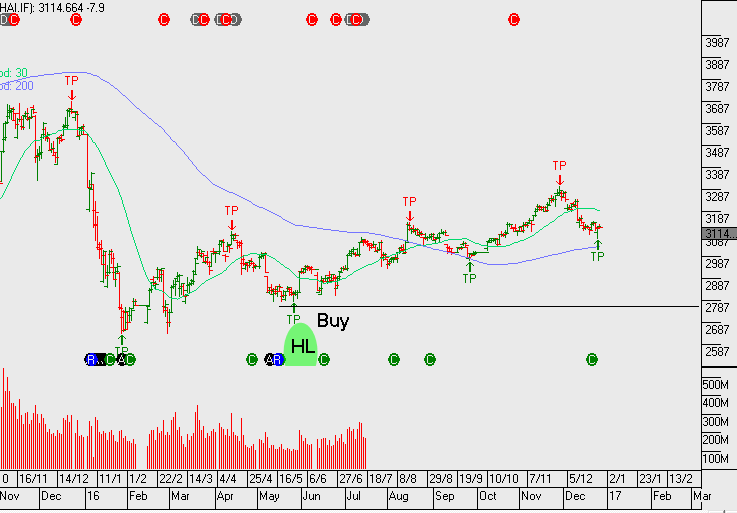
During 2016 we’ve been bullish on the Chinese equity markets which performed inline with our forecasts. The strength and the breakout in the Japanese equities on the other hand, caught us a little by surprise.
The breakout in the Nikkei has been fuelled by the BOJ’s broad-based equity ETF being program and the recent weakness in the Yen.