Over the last five years, one of the least important concerns for US Corporate Treasurers has been the forward cost of funding. However, over the last two months, the sharp rise across the US Treasury curve has exposed some notable differences in how banks perform versus technology companies perform in a rising interest rate environment.
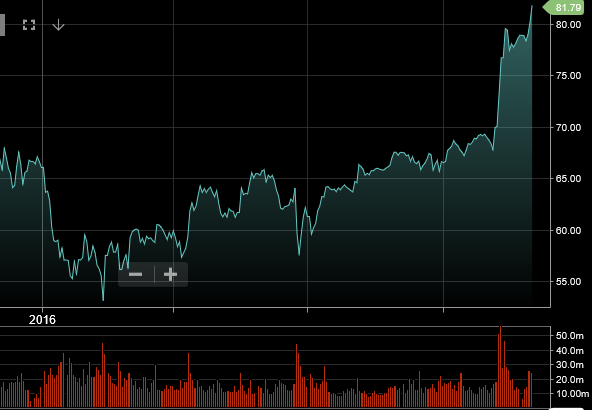
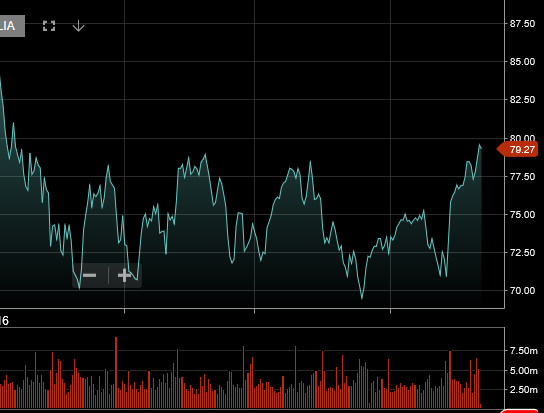
Since October 1st, the yield on the US 10-year note has surged close to 90 basis points from 1.55% to 2.44%. This is nearly a 60% increase and has helped US banking stocks, while hurting some big technology names.
For example, Since October 1st, shares of J.P.Morgan have climbed over 20% from $67.00 per share to over $81.00 per share. During that same period of time, shares of Facebook have dropped from $133.00 per share to just under $115.00 per share; a 13.5% drop.
Australian consumers borrowed less in the month of October with RBA data showing private credit growth at 0.5% (5.3% year on year) versus a YoY rate of 5.4% last month. A closer look at the data suggests Australians are interested in buying real estate and not much else. Even though housing credit growth was flat last month at 6.4%, the pace is still well above the 4.4% growth in Business credit and the rate of Personal credit; which actually dropped to -1.1% Year on year. It’s likely that the growth in housing credit has been supported by the RBA’s rate cuts in May and August. However, the RBA won’t miss the fact that lending over the last 12 months has a flat to lower trajectory, which may influence their policy directives going forward.
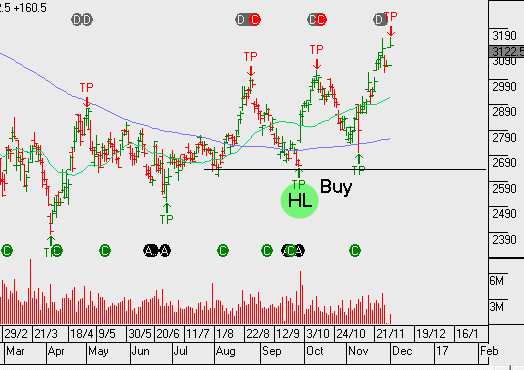
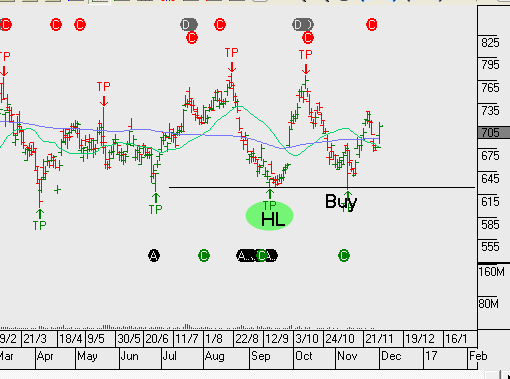
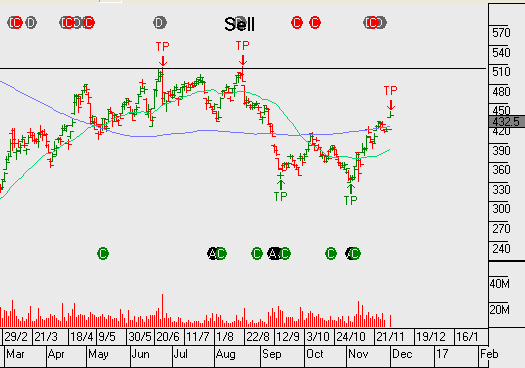
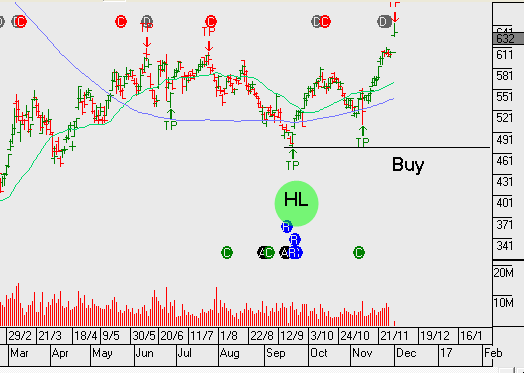
Australian banks continue to push up against the top end of the their price channels. We’re mindful of the rally in US banks helping to boost investor sentiment towards the sector, yet there is limited evidence domestically of any pickup in earnings on the horizon.
ASX signals from yesterday – we’re not convinced from a timing perspective to the point where we’re ready to take action. Although, BBN and MMS make it onto our watch list and we’ll be looking for confirmation from our momentum indicators for a turn in price.
Crude Oil prices surged as much as 10%, almost reaching the $50.00 mark, as the Organization of Petroleum Exporting Countries (OPEC) agreed to curb oil production for the first time since 2008 in an effort to reduce oversupply and support prices.
The 14 nation cartel, led by Saudi Arabia, agreed to cut production to 32.5 million barrels per day, which pencils out to a 1.2 million barrel per day reduction from current levels. Saudi Arabia agreed to take the lion’s share of the cut; lowering their daily production by 486,000 barrels per day to get the deal done.
Russia, the world’s largest Non-OPEC producer, had long resisted cutting output but has tentatively agreed to join the effort by reducing production by 300,000 barrels per day. OPEC will meet with Non-OPEC producers on December 9th.
If history is an accurate gauge, the bullish market response to this deal may be short lived. OPEC members haven’t shown a strong track record of compliance to previous production agreements. As such, the recent price action in Crude Oil could reverse over the near term as more details are released.