Currently, ASX leading Financials are being dragged higher as the US equity rally continues into the lead up to their fourth quarter earnings results. We’re somewhat sceptical of the valuation support and yesterday started hedging our banking exposure in client portfolios. This was done through using in-the-money European-style calls over CBA and slightly in the money February calls over NAB, as two examples.
In the case of CBA, we stay exposed to the February dividend and franking credit but have hedged a price pullback of up to 5% between now and March.
In NAB, we’ve hedged to a similar extend but without the need to protect the dividend. NAB’s next payment period is not until May
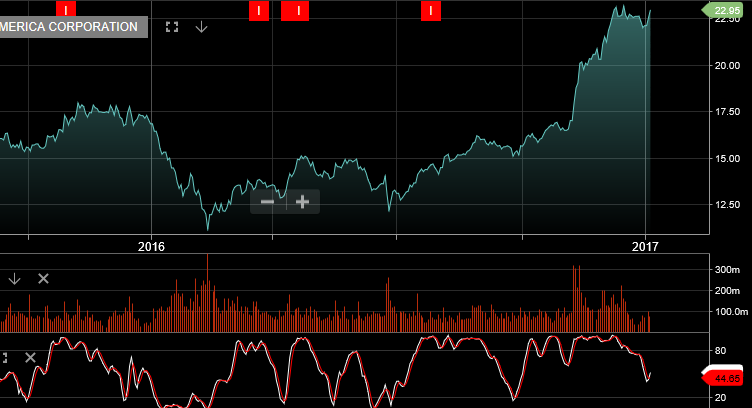
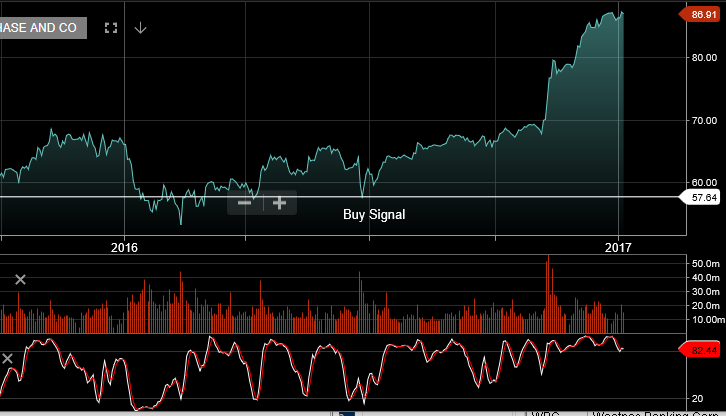
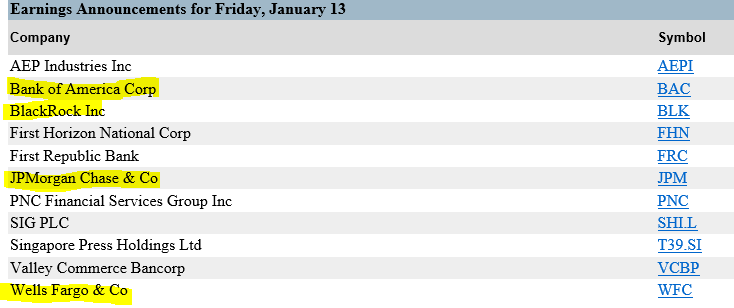
On 13th of January, the first of the major US financial institutions begin announcing their fourth quarter earnings results. Bank of America, JP Morgan and Wells Fargo will be the key results to watch.
The rise in US financials has been significant by any measure; multiples have expanded ahead of what investors are hoping to be record levels of profit and bullish forward guidance. The US financial sector has been boosted by the expectation of higher interest rates, deregulation and high trading earnings to drive profits.
However, we have concerns: economic growth in the US is not that strong, the year-over-year GDP growth rate was only 1.7 percent in the third quarter, S&P500 average year on year EPS growth was only +4% in the third quarter and it’s had to see growth improve dramatically in 2017, especially with a stronger US dollar.
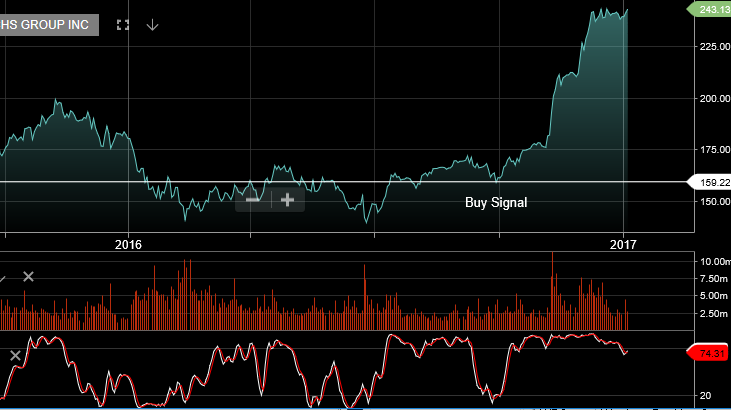
Chart – Bank of AmericaChart – JP MorganChart – Goldman Sachs
Based on our view that risk assets are over extended and S&P500 earnings will most likely not support the current PE multiple, we are tilting client portfolios towards a more defensive asset mix and using derivatives to generate lower risk returns.
Over the next 3 months, portfolios with allocations towards banks, resources, industrial and property run the risk of seeing significant volatility for little or no added upside benefit. In times like these, investors need to look at their strategy for managing risk and calculate the potential upside of staying fully exposed versus reducing exposure, moving to a defensive asset mix and generating returns through at-the-money calls.
We like CSL, SHL, RHC, ANN, TLS, TCL, WFD, CCL and CTX as examples of defensive names that can deliver both capital growth, as well as 10% of annualised income through the upcoming dividend and call option premium.
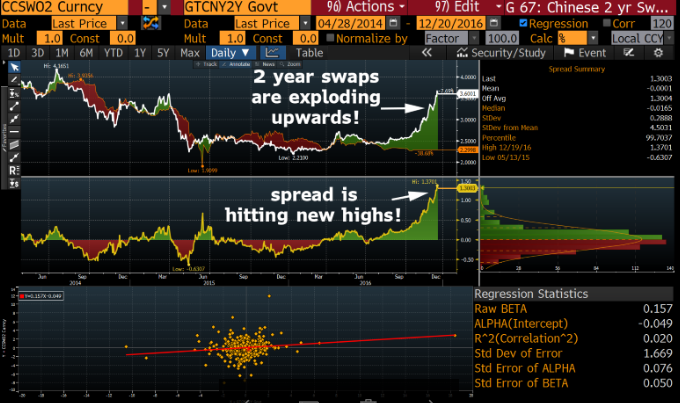
Over the past two months, the Chinese Interbank Funding market has come under structural pressure as the Government has introduced changes to domestic capital control regulations. The goal of these changes is to stem the flow of Yuan leaving the country.
An unintended consequence of these new capital measures has been acute liquidity shortages in the secondary bond markets, which have triggered two trading halts over the last month. The chart shows how the 2-year swap rates have surged higher as uncertainty about future funding lines has seen overnight lending rates gyrate between 3.5% to 17.00% over the last 60 days.
The primary concern for Australian investors is how this bond market instability could impact Australian exports of raw materials, consumer goods and agricultural products to the mainland. As a knock-on effect, the Shanghai Index has lost over 4% over the last month and the Chinese Yuan pricing has increased in volatility…….neither of which were intended goals of the new capital measures.
We will continue to monitor developments in the Chinese market and pass along any trade suggestions which the may be triggered from the Algo engine.
Looking across the financial horizon, it appears by many measures that 2016 is ending with similar dynamic as 2015: G-7 stock indexes are at or near their highs, the USD Index is on an upswing, the US Federal Reserve lifted rates causing bond yield to firm and Gold prices are stabilizing after a sharp November drop.
As such, the financial media is content to wrap up the year by only focusing on the price action from the last two months and ignoring the two-way market volatility experienced in the previous 10 months.
Looking into 2017, it’s worth noting that as optimistic as the end of 2015 outlook was, the SP 500 started 2016 under pressure and dropped over 250 points, or 12% by January 20th.
We have identified three potential flashpoints which may trigger a significant correction from the recent post-US election rally during the month of January.
First, the Italian banking sector continues to sag as political manoeuvring has greatly outpaced the progress of any meaningful economic solution. At this point, the focus has been on the bailout of Monte Paschi Bank. Recent “stress tests” have shown that the solvency gap needed to rescue Italy’s oldest lender has grown from €5.5 billion to over €10 billion.
The immediate contagion risk has spread to 10 other EU banks who are holding substantial Monte Paschi debt obligations.
The second potential flash point stems from recent liquidity shocks in the Chinese bond market. Credit conditions have tighten sharply over the last two weeks as over 25 corporate bond issue face a potential default.
This pressure has seen 2-year swap rates spike higher, which has forced the Peoples Bank of China (PBoC) to inject over $60 billion into the short-term money market just to keep the secondary Treasury market from triggering a trading halt…….like it did on December 15th.
Many investors overlook the impact that even temporary credit shocks can have on global equity markets. However, according to some estimates, the global bond market has more than tripled in size over the last 15 years and now exceeds over $ 100 trillion.
By contrast, Dow Jones Research puts the value of the global stock market at just under $65 trillion. In the US alone, bond markets make up over $40 trillion in value, compared to less than $20 trillion for the domestic stock market. In this sense, as G-7 Central bank policies have removed traditional market anchors, a liquidity or solvency shock in a domestic bond market can have a profound impact on global equity markets.
The third potential flash point involves the US earnings season. US companies will begin reporting in the fist week of January with JP Morgan , BoA and Wells Fargo leading the banks starting on January 13th. Forward estimates suggest that the post-election rally has lifted many of the banking names into price valuations which the earnings reports may not be able to support.
It’s not our base case that an external market shock will trigger a protracted sell off in global equity prices and derail the bull market structure during 2017. However, we feel that it’s important for investors to be aware of the potential of such risks and have a strategy in place to protect portfolio holdings during a market correction.
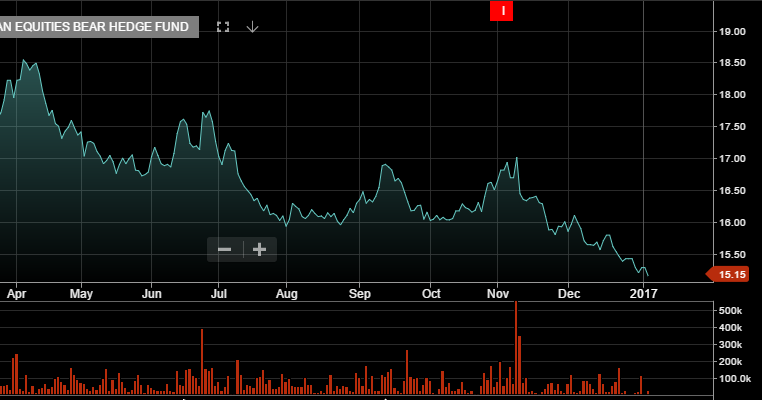
A product which fits this description is the BetsShares BEAR Exchange traded fund (ETF). The BEAR EFT Gives investors a simple and accessible way to obtain ‘short’ exposure to the market.
If you would like to learn more about how the Beta-Share BEAR ETF can protect the long-side of your portfolio, or if you just want to learn how to profit from a downside correction in the ASX 200, get in contact with us and we’ll be happy to introduce you to this dynamic product.
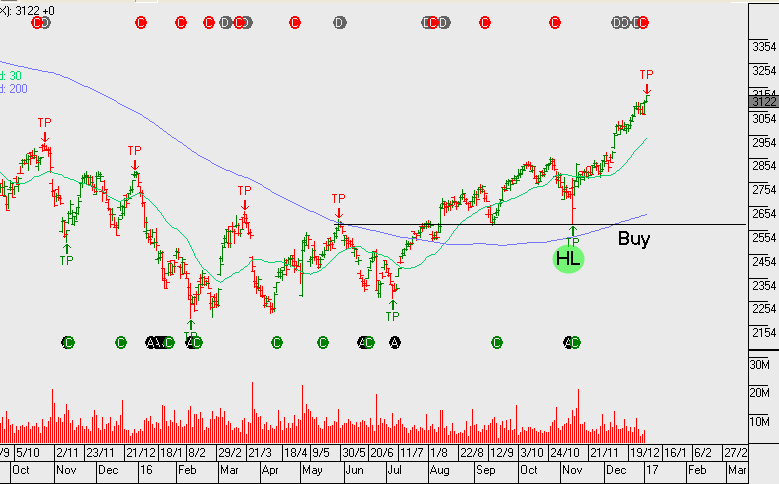
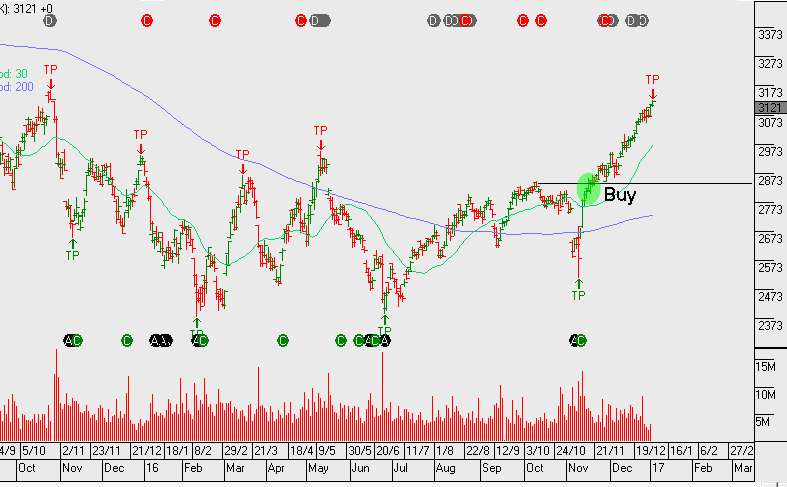
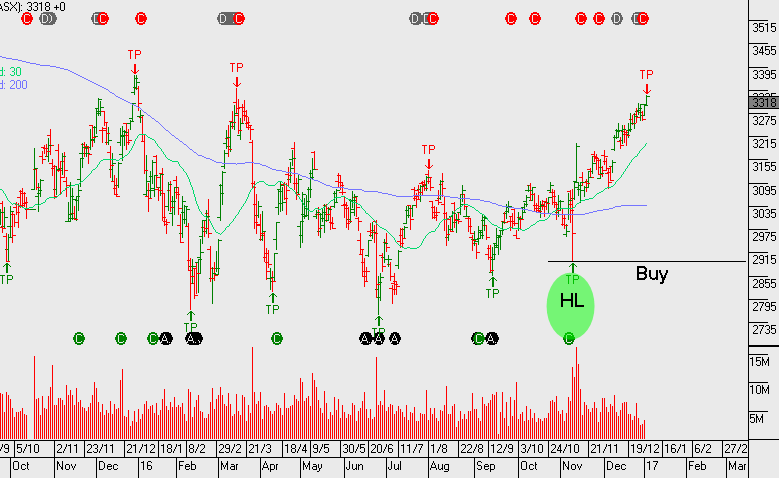
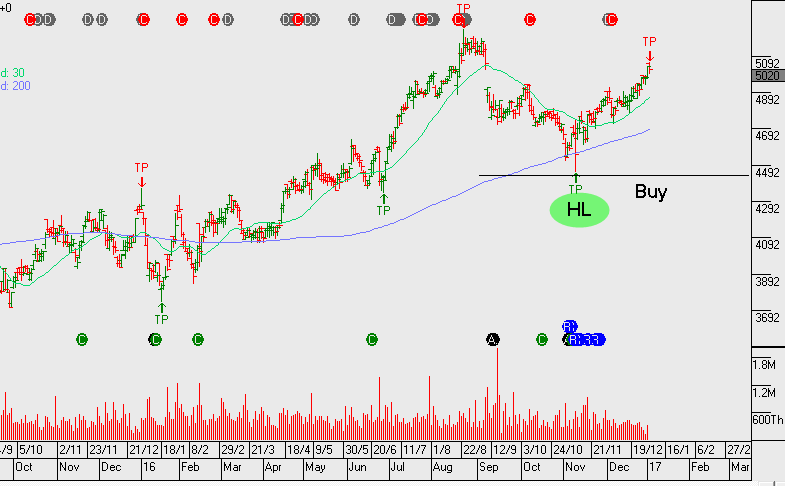
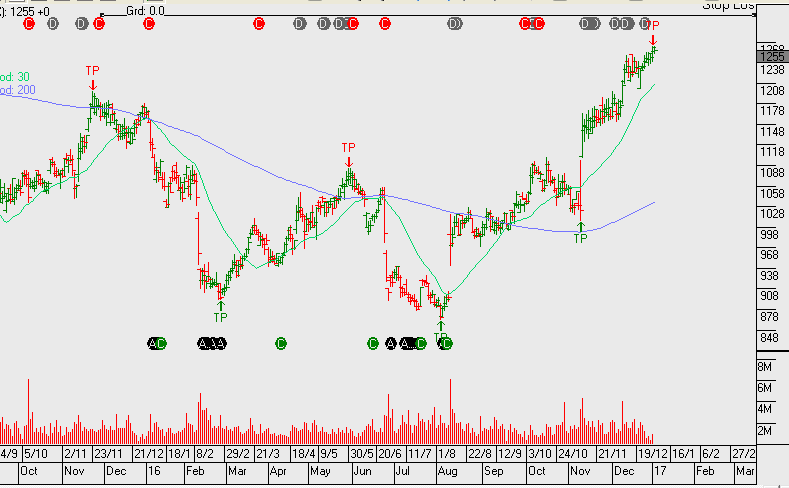
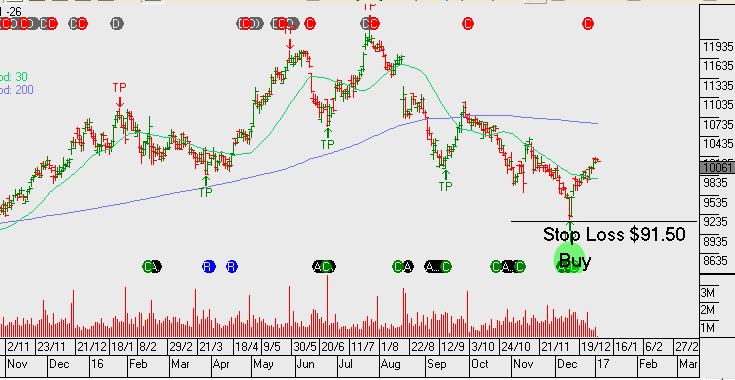
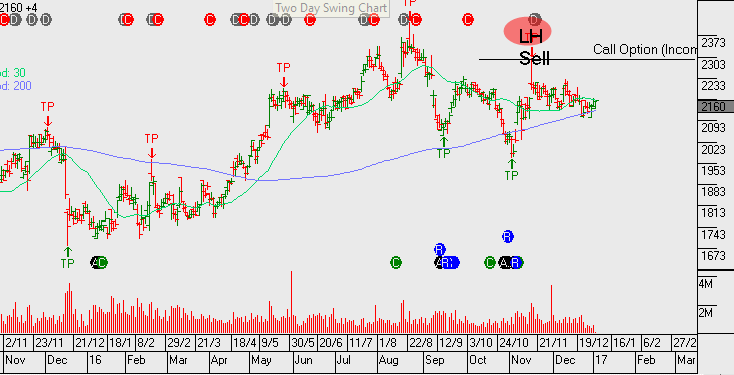
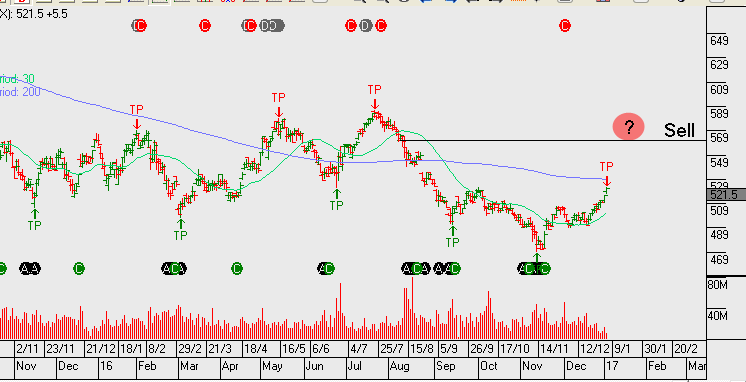
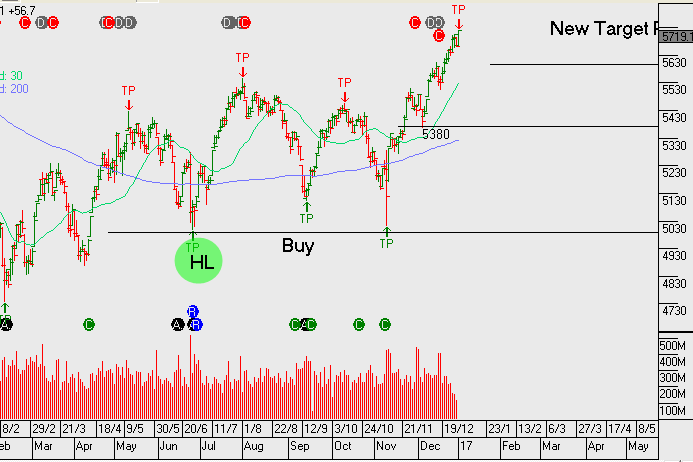
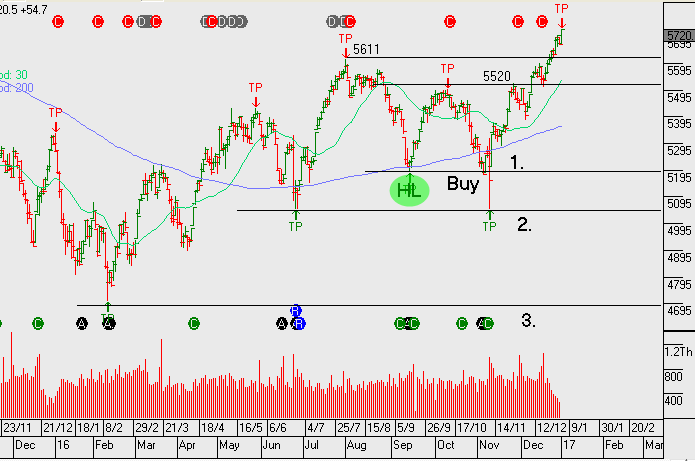
The XJO (ASX200) and the XLF (ASX top 50) continue to trend higher following the breakout which began in early December. We’re now up around 5% from the December low and we’re up over 20% from the 2016 low formed in January.
The XJO is trading 17.5x forward earnings on a 4% yield. Our focus will soon shift towards the upcoming US earnings which begin later this week.
Chart – XFL (ASX top 50)Chart – XJO (ASX top 200)Table – US Earnings