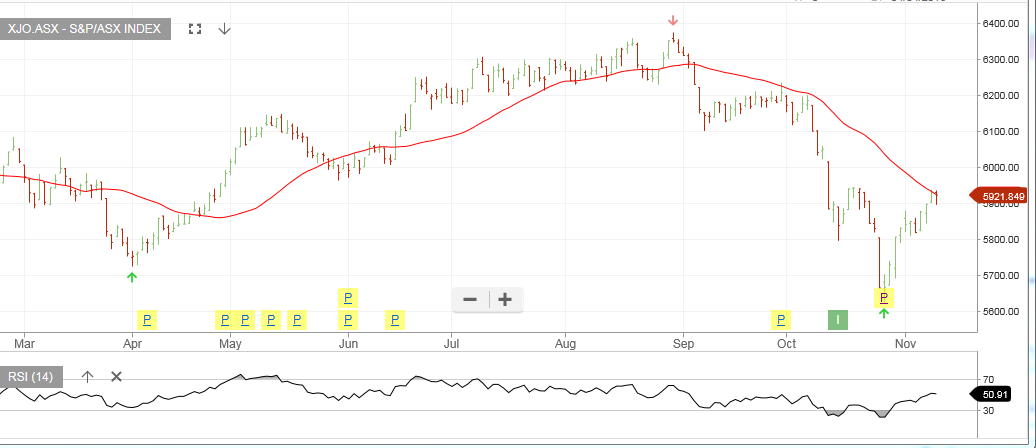
After sinking to 5624 on October 26th, the XJO index has rebounded over 5% to reach a 3-week high of 5933 on Friday.
As illustrated on the chart below, this retracement looks to have found resistance near the 30-day moving average at 5920.
We consider this technical level an important inflection point in determining the near-term direction of the index.
The next key resistance level will be 5965. However, a break of the 5815 level will suggest a retest of the previous low.
 XJO Index