Stay Short BOQ

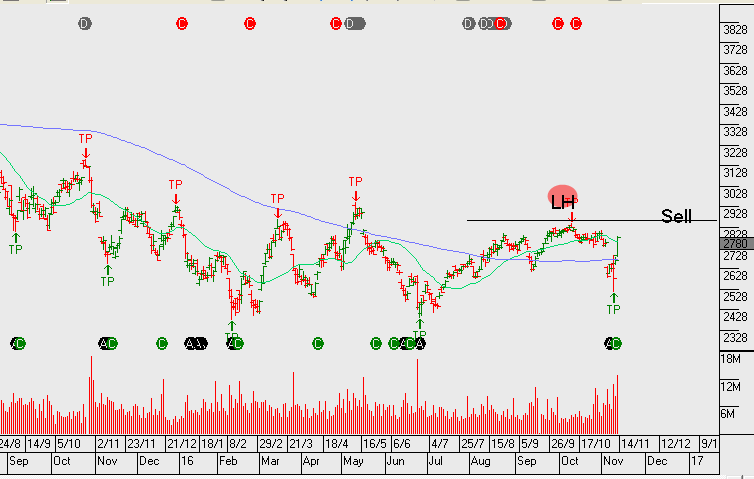
In a recent analyst review, the forward pricing on BoQ has been gauged at 12% overvalued and  adjusted lower from current levels to $11.50 over the medium-term

The note focused on the bank’s balance sheet being skewed towards residential mortgages  and that a rise in bad debts will put downside pressure on operating margins.

We agree with the initial downside target of $11.50 and see scope for some range extension into the low $11.00 handle.

Bank of Queensland 


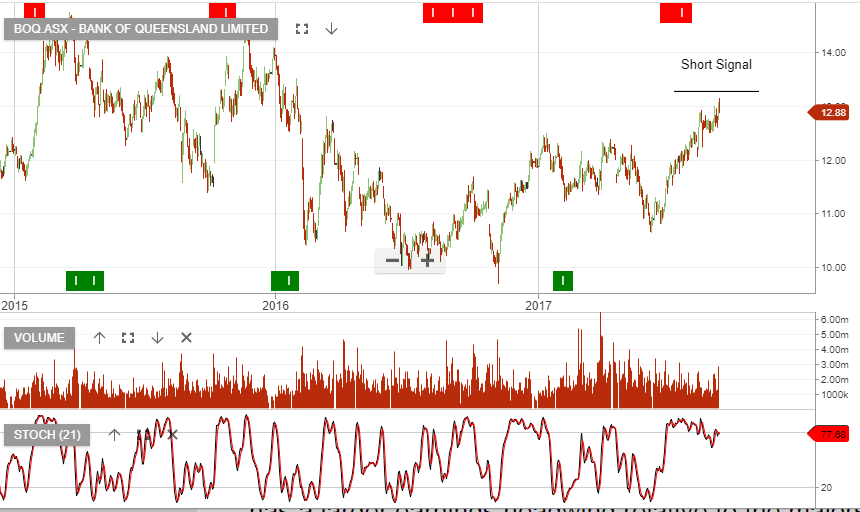
BOQ – Sell into Strength

We feel traders should look to sell into the current price rally in BOQ.

Slowing credit growth conditions will act as a headwind to mortgage profitability and with BOQ now trading at the top end of the valuation range, any further price extension provides a good opportunity to set a position on the short side.

We have BOQ delivering flat EPS growth of $0.93 and DPS of $0.77, placing the stock on a forward yield of 5.6%

Bank of Queensland


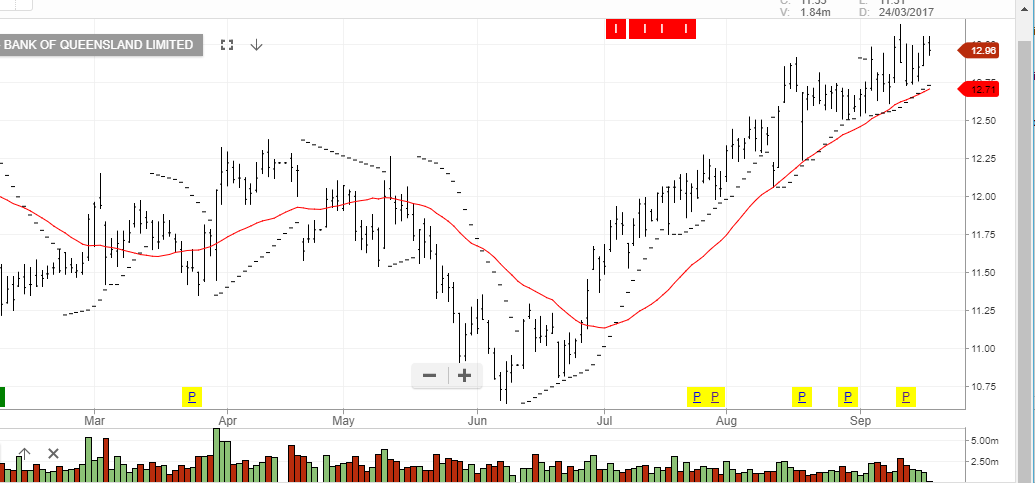
ALGO Update: Stay Short BOQ and BEN

The ALGO engine triggered a sell signal for BOQ on July 25th at $12.00, and for BEN on August 18th at $12.49.

Over the last two weeks, shares of these two regional banks have sold off less than the shares of the 5 larger domestic banking names.

Over the near-term, we see that divergence fading and expect the downside momentum in BEN and BOQ to pick up pace going into September.

We have adjusted our target prices to $11.15 in BEN and $12.05 for BOQ.

Bank Of Queensland

Bendigo Bank

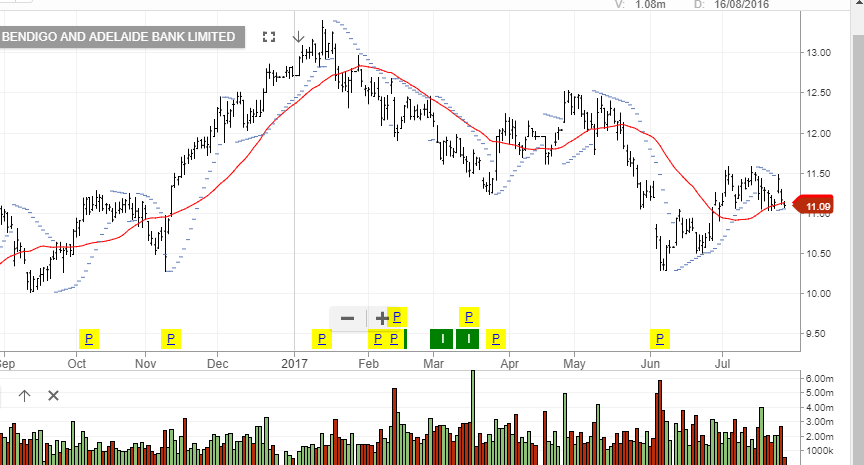
Algo Short Signal – Bendigo Bank

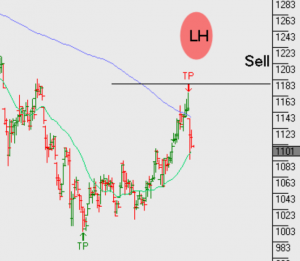
Our Algo Engine is now flagging the “lower high” technical structure in Bendigo Bank.

The stock has seen a short squeeze following the recent earnings result and is now likely to find renewed selling pressure at $12.40.

Investors should remain on the short side of this trade with a stop loss on a break back-up through the $12.50 range.

Chart – BEN

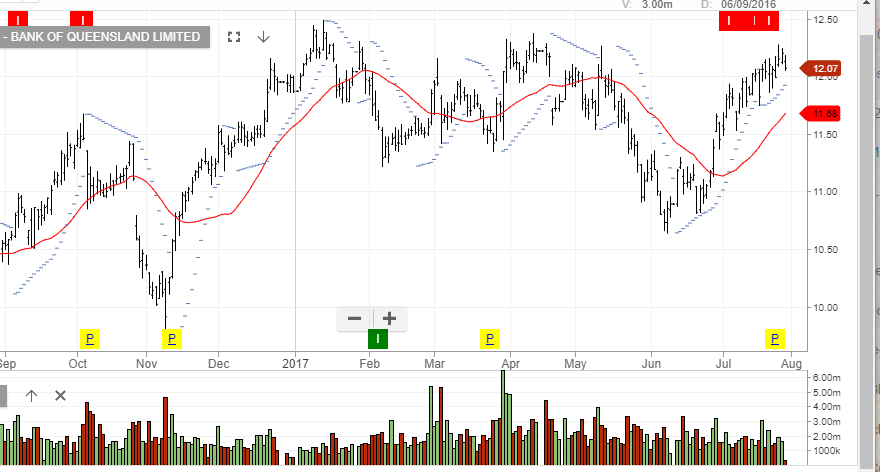
We also have  a short signal in Bank of Queensland.

Chart – BOQ


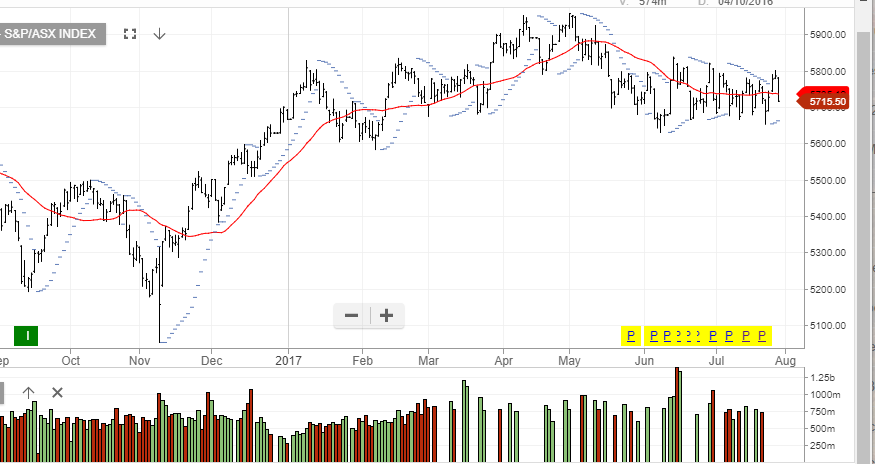
How Long Will The XJO Range Trade?

Over the last 12 weeks, the XJO index has traded in a range bound, pennant formation.

In technical terms, this is known as an “indecision” pattern and is usually resolved by a measured move through the top of the range, or broken through the bottom of the range.

The current price set-up has been bound by the June 8th low of 5606 and capped by the June 15th high of 5850.

After one of these levels are breached, the measured move would be expected to reach the May 2nd high of 5950, or drop down through the low price of 5606 posted on February 6th.

The banking sector is the heaviest weighted group of stocks in the XJO. As such, the direction of the banking shares will largely determine the direction of the XJO index.

Our base case has been that the major banks will face challenges to grow revenue in the current market environment and that pricing risks are skewed to the downside.

These valuation concerns apply even stronger to the regional banks; BOQ and BEN. After recent price rebounds in these two stocks, we believe that they could trade lower and reach $10.50 and $10.00, respectfully.
XJO

BOQ

Bendigo


BOQ: Caution In Front of Results

After trading as high as $12.50 on January 12th, shares of BOQ have followed the same “sideways-to-lower” pattern as the rest of the Australian banking names.

With first-half 2017 results due on March 30th, this pattern could continue and even breach the February low price of $11.30.

The headwinds of negative loan growth and falling margins don’t appear to be fully priced-in at current levels.

The trading multiples of BOQ are not cheap, and with 2017 EPS growth estimated at under 3%, we believe an $11.00 price is more likely than a $12.00 price over the medium-term.

Australian Bank Trends – WBC & ANZ Breakout

We now have ANZ and WBC creating a higher low formation. However, CBA and NAB still remain below the recent highs within the downtrend that’s been in place since May 2015.

Back in August, ANZ was the first to break the downtrend and now WBC has followed. Within the regional banks, between BOQ and BEN, it’s Bendigo that’s displaying a more bullish price pattern.

Although the breakout in financials is strong at present, we don’t see too much further upside. As reflected in the recent earnings results, the banks are having difficulties growing top line revenue. Our largest bank exposure in client portfolios is Westpac. We’ve left this name uncovered at present, however, it’s likely we’ll identify a point this week to add covered calls to enhance the yield.

ANZ goes ex-dividend $0.80 on Monday & WBC also goes ex-dividend $1.00 on Monday.

anz
Chart – ANZ
wbc
Chart – WBC
cba
Chart – CBA
nab
Chart NAB
Chart - BEN
Chart – BEN
boq
Chart BOQ

BOQ FY16 Earnings Result

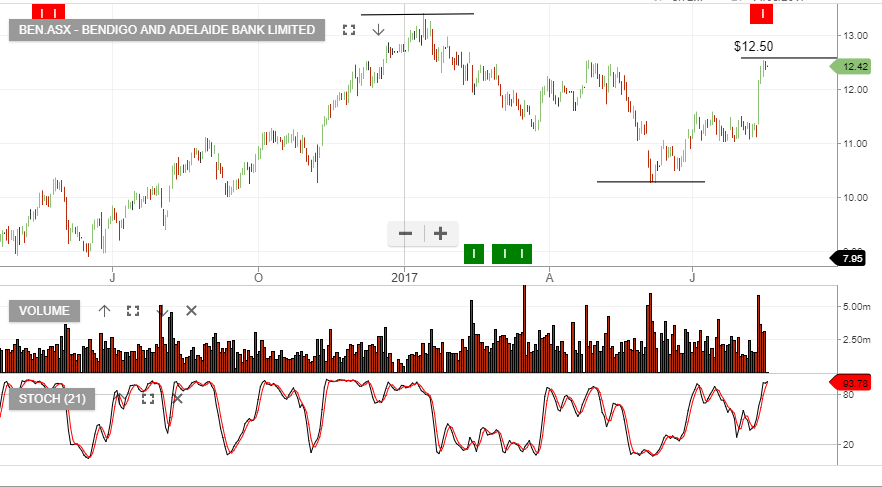
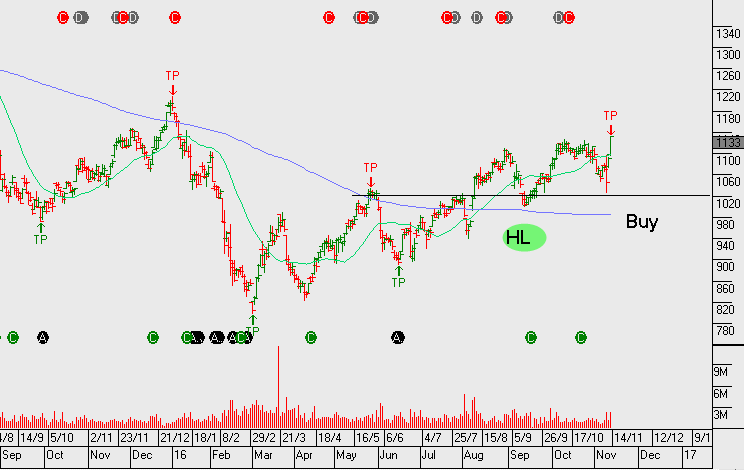
A quick look at Bank of Queensland and Bendigo following the release of the BOQ FY16 earnings result.  BOQ.ASX Underlying result was weaker than market expectations, predominately driven by greater than expected margin pressure.

BOQ.ASX FY17 outlook now appears to offer flat EPS growth at best, assuming a $0.78 FY17 dividend, it places the stock on a 6.9% fully franked forward yield.

BOQ.ASX

boq

BEN.ASX

ben

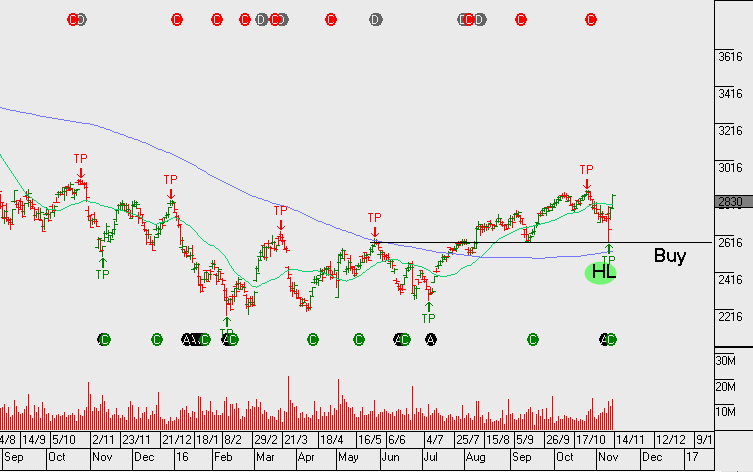
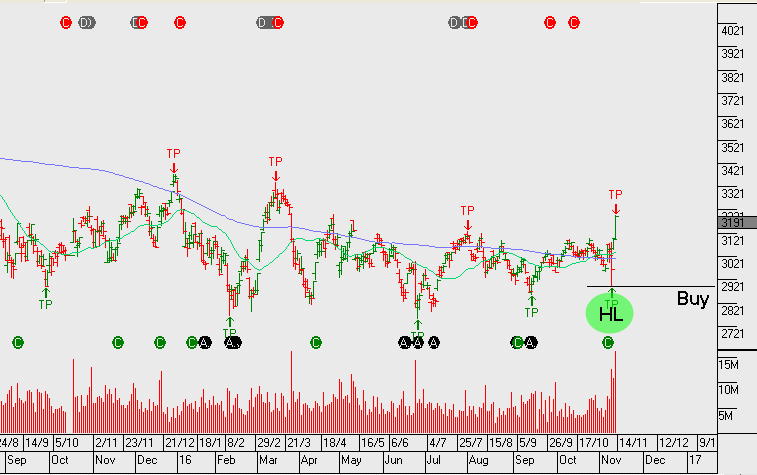
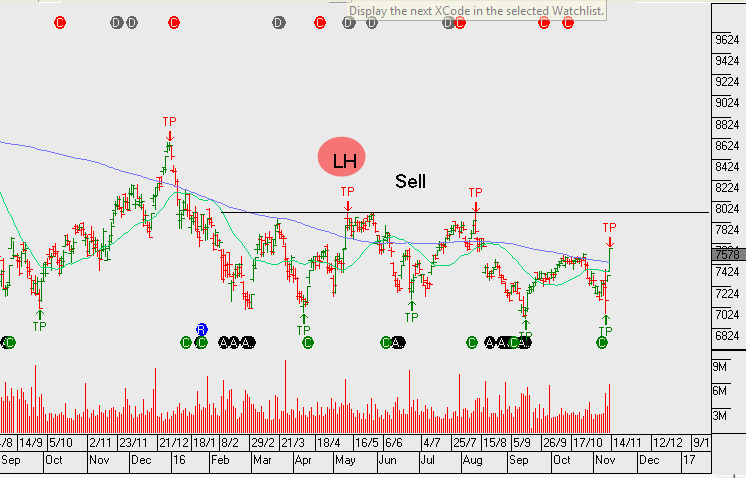
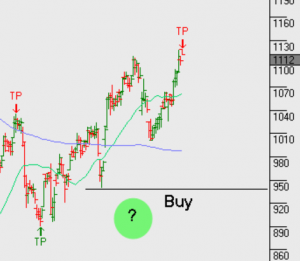
A technical summary of where we see price action heading is different in BOQ opposed to BEN, whilst we see short term downside pressure in both names, (despite the yield support), a retracement in BEN.ASX back to $10 will likely trigger a buy signal in our algorithm engines. Whereas, BOQ.ASX remains in a structural downtrend and it’s the current short signal that draws our attention.