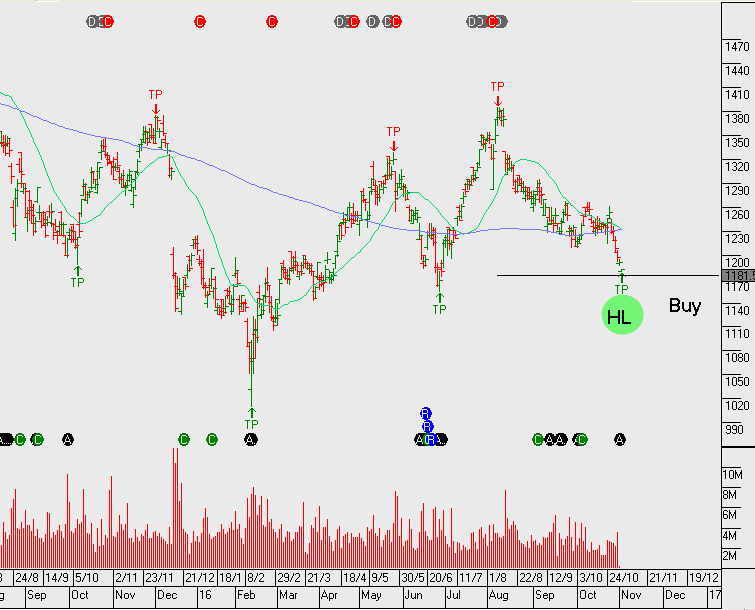
Suncorp – Holding Support

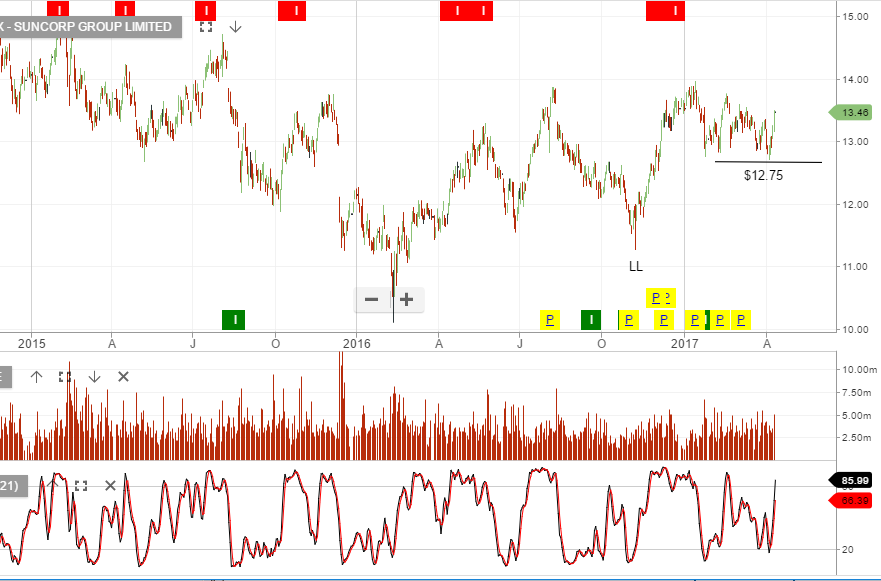
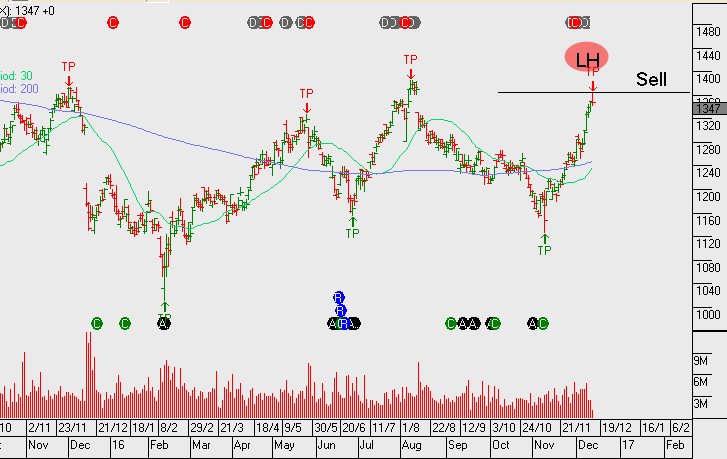
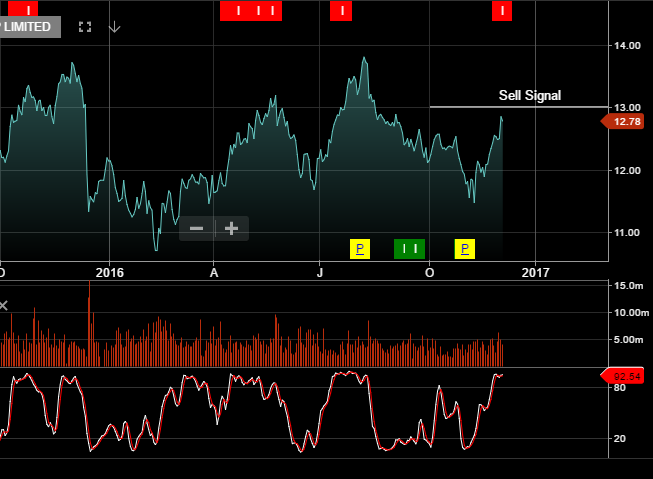
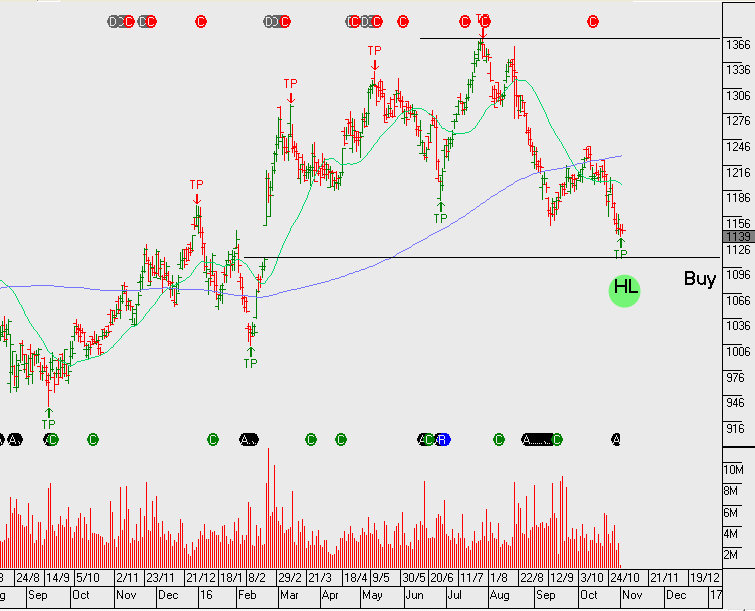
After a series of lower high structures over the past 2 years Suncorp looks to have found a short-term consolidation range with $12.75 support and $14 resistance.

We recently took profit in our long Suncorp exposure when the stock was last trading $13.75.  The stock is now back on our watch list but a break below $12.75 will show the downtrend remains the primary driver.

Chart – SUN


Suncorp

Suncorp shares have traded over .5% higher to $13.20 today after announcing a 1.3% increase in its half year profit results.

The company reported a net profit after tax of $537 million for the six months up to December 31, which is up from $530 million a year ago.

This represents top-line growth of 4.3% and, based on forward guidance, will raise its fully-franked interim divided by 10% to 33 cents per share.

This 33 cent dividend represents a payout ratio of 72% of cash earnings.

Chart - SUN

Australian Bank Profit Announcements – Key Dates

Bank profit announcements start in February with the following key dates worth noting.

SUN 9 February, BEN 13 February, CBA 15 February along with 1Q17 trading updates from ANZ and NAB in February.

Following the recent rally in bank shares, we see the current trading range as full value, therefore, placing the banks at risk of being buffeted by any increase in market volatility.  Although net interest margins have improved, the prospects of earnings growth is modest with the outlook between 1% – 4% growth at both top and bottom-line.

We also remain concerned that the cycle for bad debts is likely to rise from the current historic low levels.

Charts – Aust Bank ETF


Algo Engine – Suncorp

We note the algo short signal that occurred Friday on Suncorp. The stock is making a lower low and lower high pattern and resistance is at or near $13.00.

Given the backdrop of equities looking extended, in particular the financials, we’re willing to look at SUN on the short side with stops above $13.00. Downside price target will not extend past $12.25 as the 6% yield remains well supported. This is a trade that will be driven by index selling rather than company specific weakness.

For our portfolio clients holding SUN, we use this as an opportunity to enhance the yield and sell $13 calls into June 17 for a $0.50 credit, whilst keeping exposure to the $0.30 February dividend. This enhances the annualised cash flow to over 10%.

Chart - Suncorp
Chart – Suncorp


Buy Signals – Now Trading on Support

The following group of stocks offer above average earnings growth, structural uptrends and are currently trading back on support levels that warrant closer attention.

ASX, AMC, BXB, JHX RHC, SEK, SHL, SUN and TWE.

asx
Chart – ASX
Chart - AMC
Chart – AMC
bxb
Chart – BXB
jhx
Chart – JHX
sek
Chart – SEK
Chart - SHL
Chart – SHL
Chart - SUN
Chart – SUN
Chart - TWE
Chart – TWE

More detail on the Investor Signals portfolio allocations and derivative overlay strategy will be provided in the October ASX top 50 Video Market Report.


Suncorp FY16 Earnings Result

Suncorp’s (SUN.ASX) FY16 earnings result was below consensus with core earnings of $1.1b. Total FY16 GI margins were down on the same time last year. Banking profit of $390m was ahead of consensus.

FY17 outlook for $1.2b profit with 2- 3% EPS growth and dividends per share (DPS) of $0.76 placing the stock on a forward yield of 5.8%

No signal present.