Despite the turmoil on Wall Street this week, we’ve seen home-builders, autos and a handful of other companies deliver positive returns of 5%+.
Money is rotating out of technology, (down 12% this month) and into the over-sold sectors and stocks from the past 9 months.
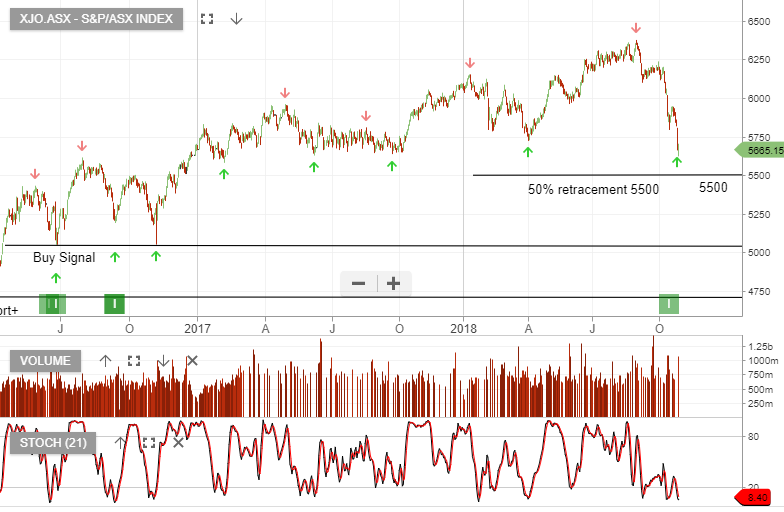
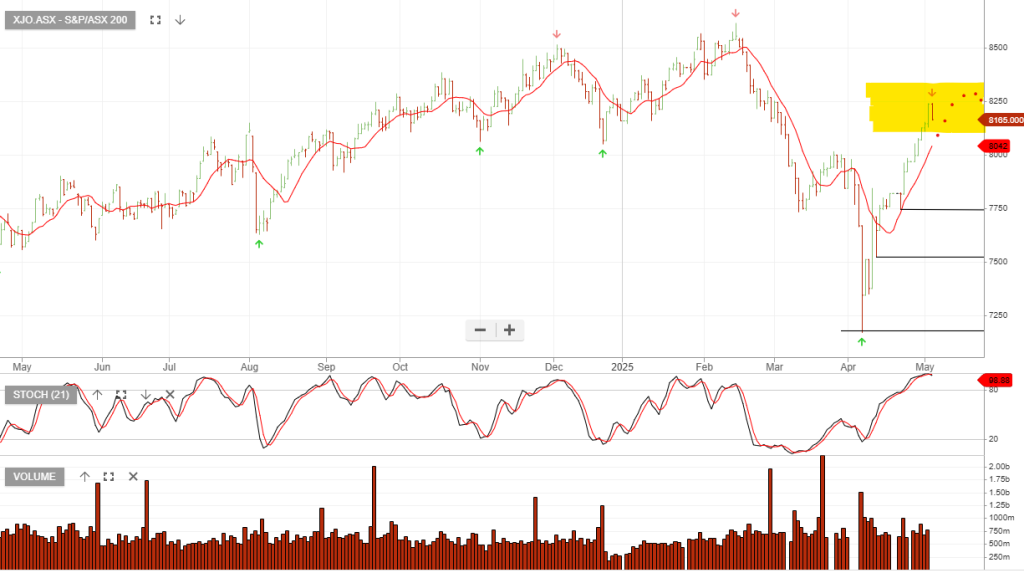
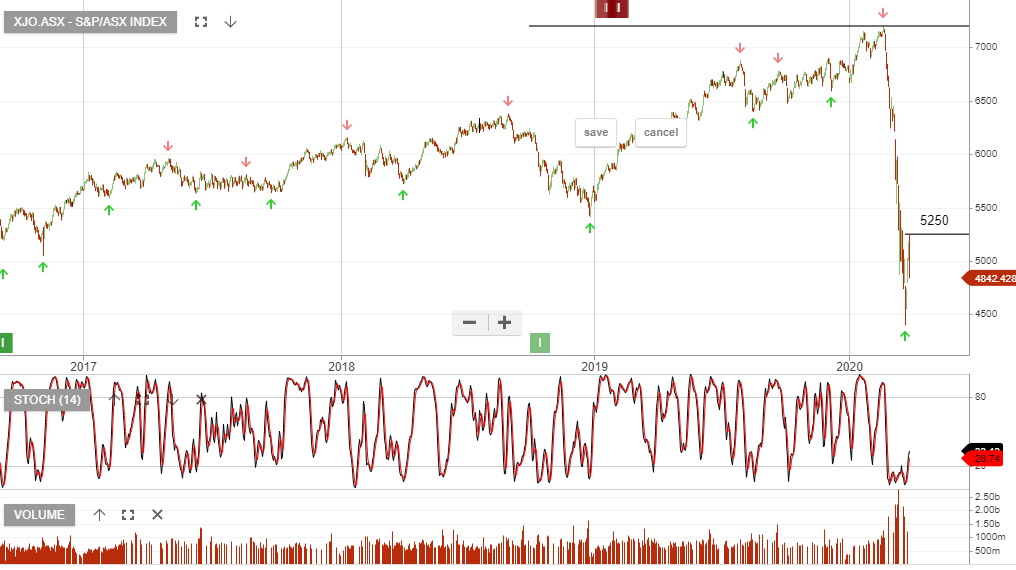
So where is the bottom in the XJO?
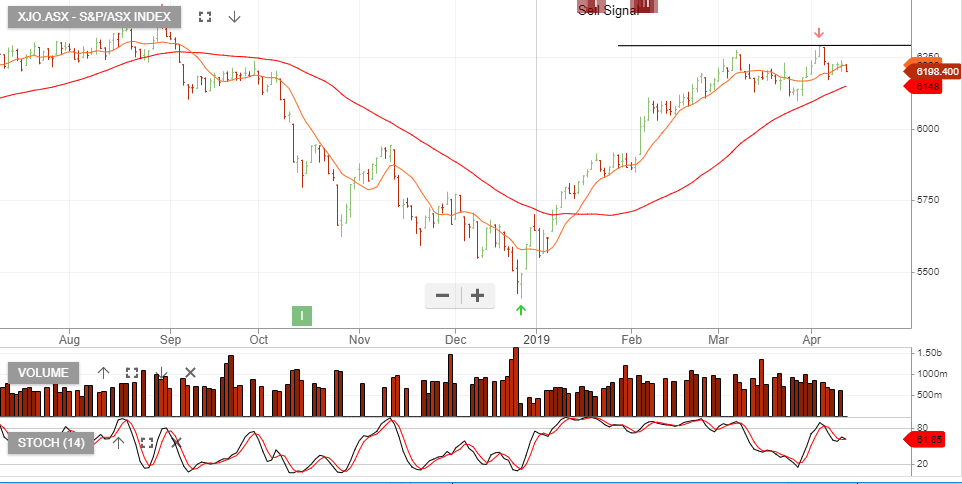
As illustrated in the chart below, the 50% retracement level in the XJO is approximately 5550 points.
Whilst there’s no certainty that buying support will build at this level, history suggests that investors should be watching the short-term momentum indicators closely for an inflection point.
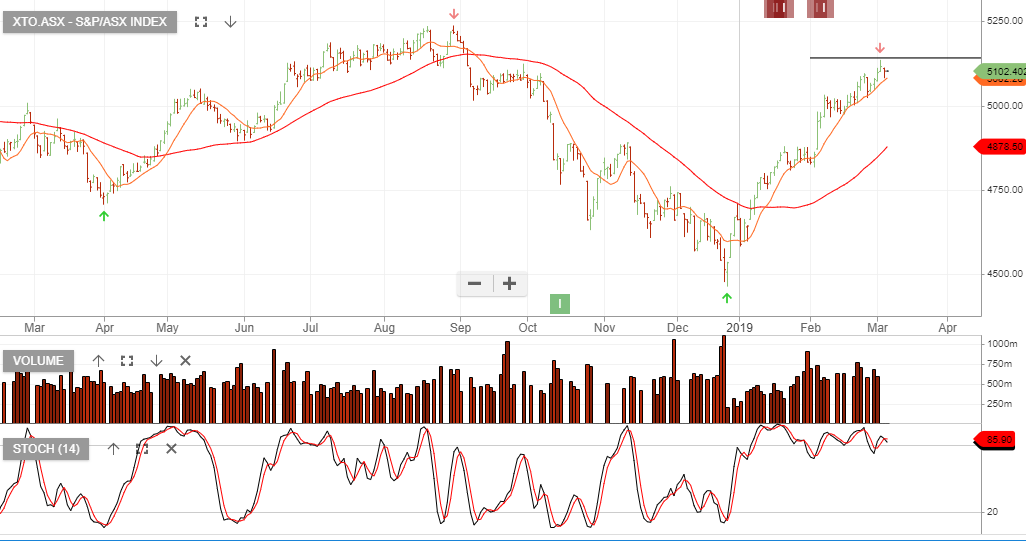
In Monday Morning’s “Opportunities in Review” webinar, we’ll identify the corresponding price levels within the ASX 100’s “biggest and best” companies.
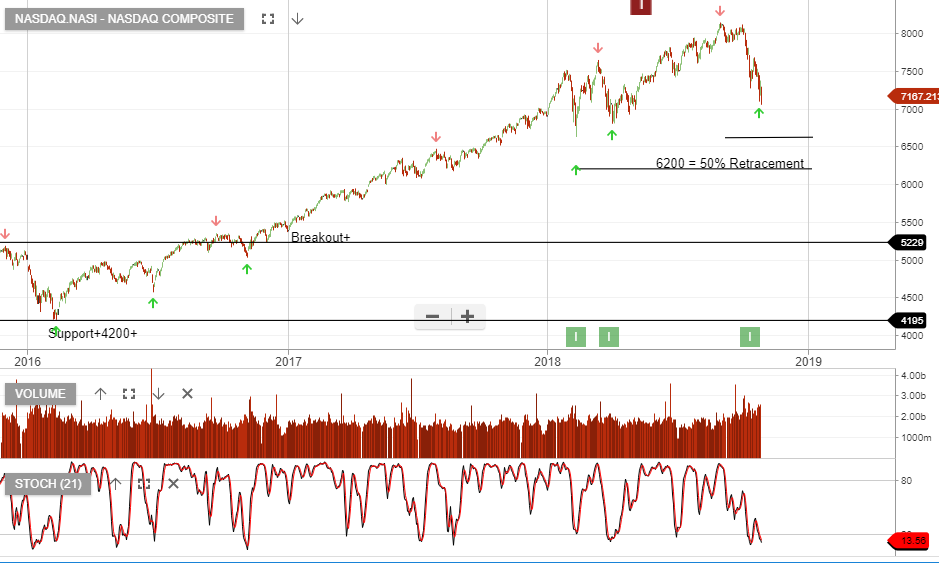
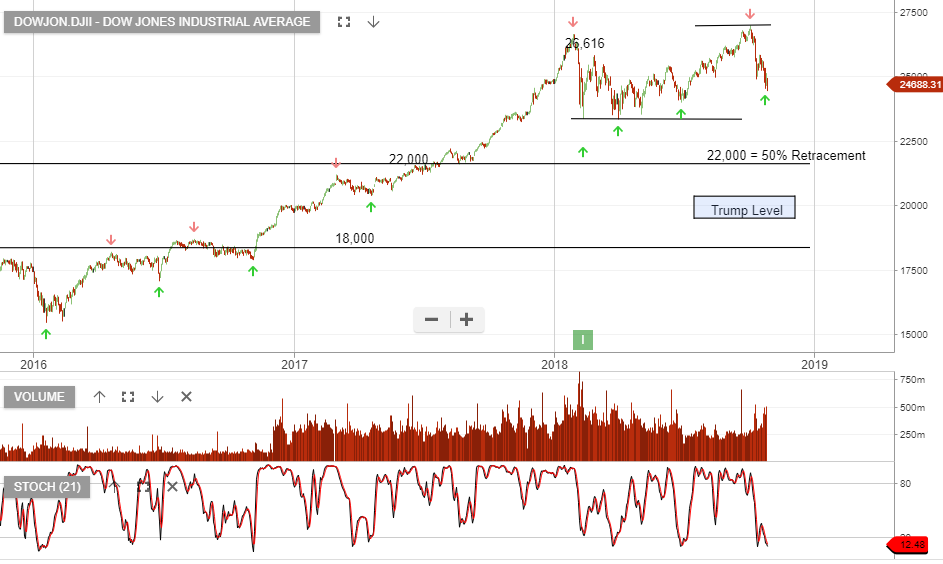
The NASDAQ and Dow Jones Index have further downside before finding their respective 50% retracement levels.
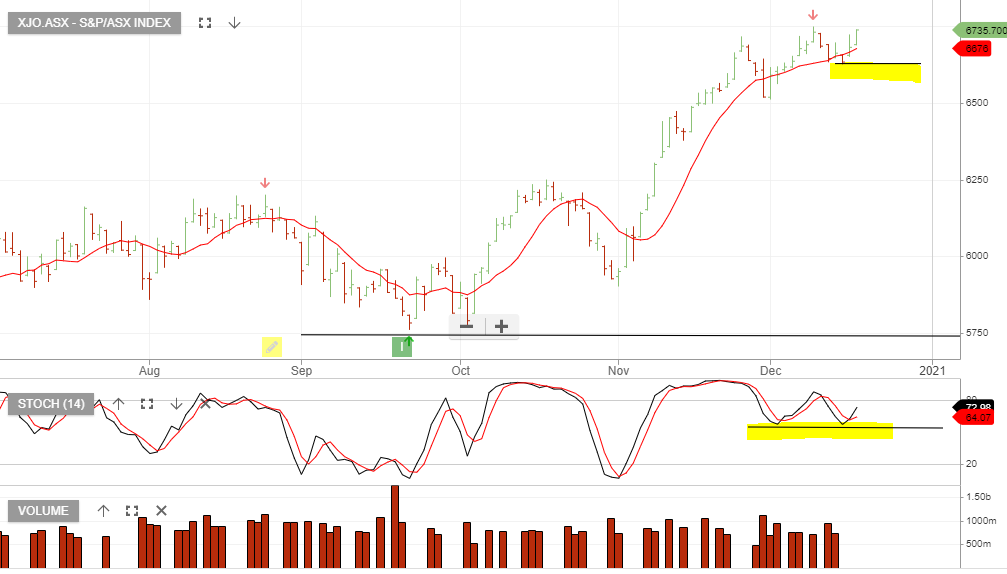
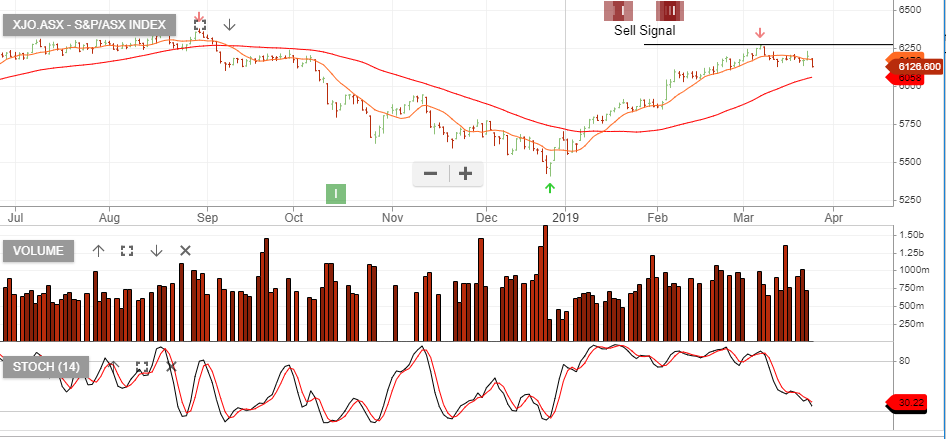
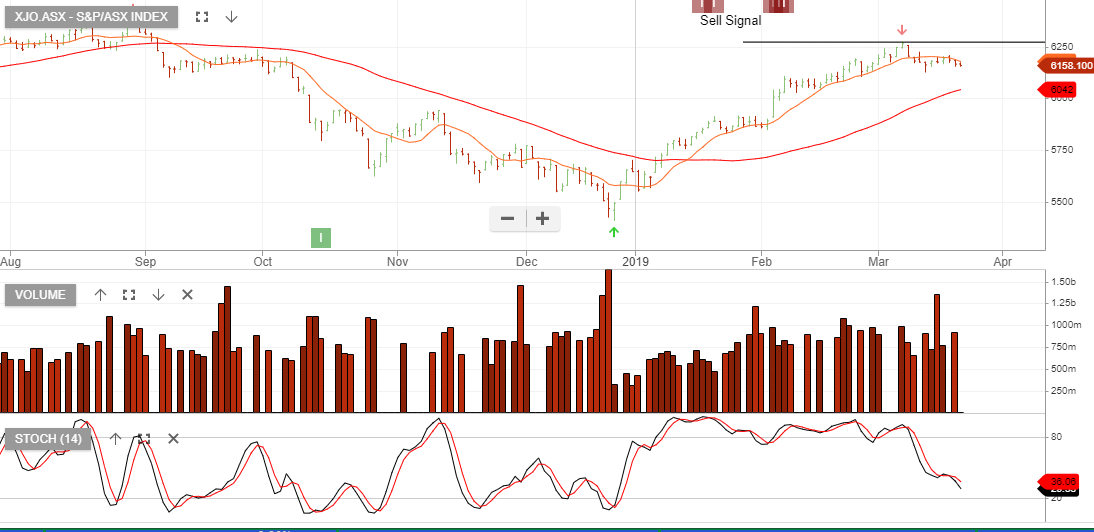
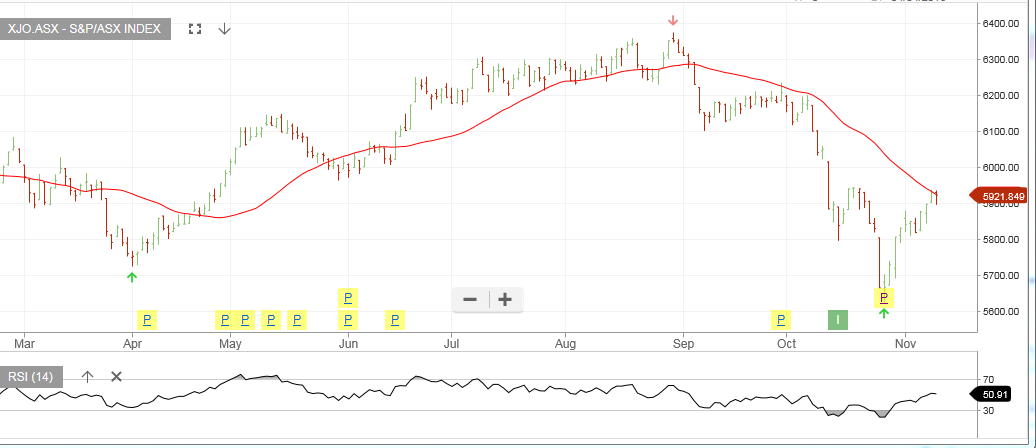 XJO Index
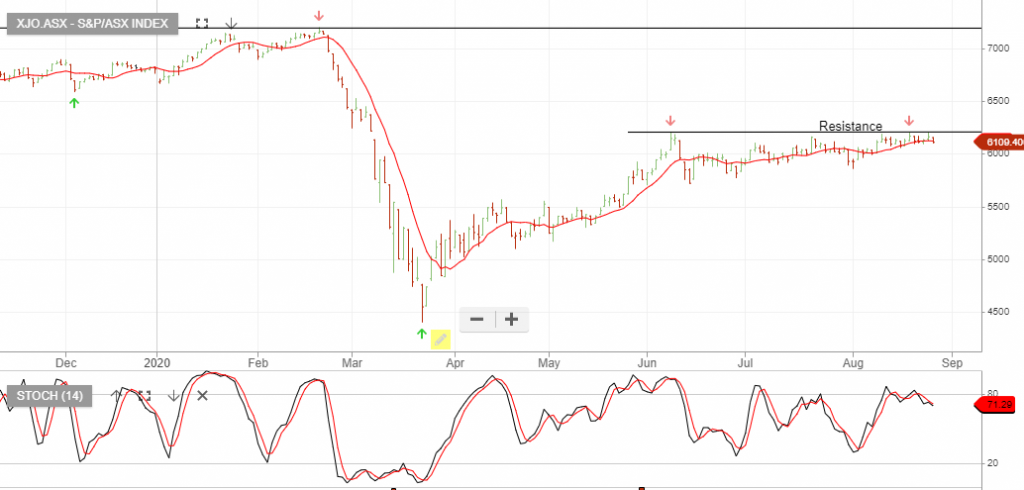