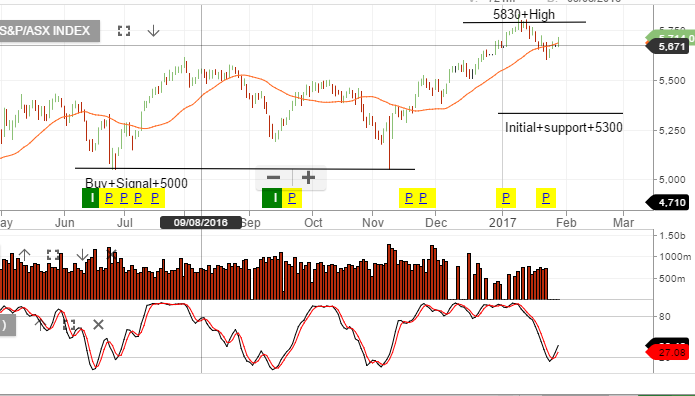
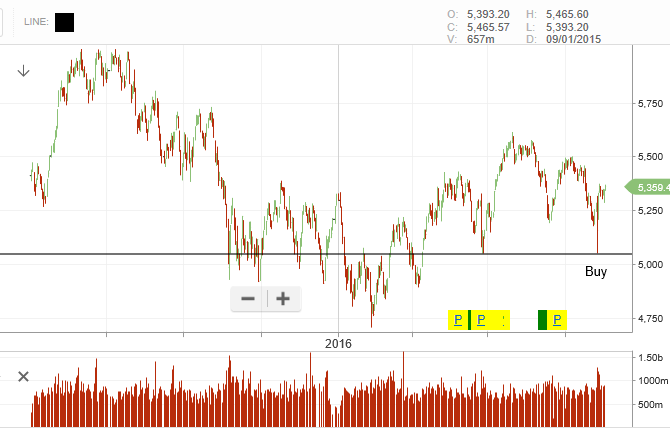
The XJO has bounced off Monday’s low of 5600 points. A combination of the US indices trading modestly higher and the short term oversold conditions in the Australian banks, lead to the minor rally in the XJO. However, with relatively weak top line revenue growth in the US, we still remain cautious on the expected price action in the week ahead.
A break above 5830 will be bullish and a rollover in price around 5750 followed by a later break of the 5600 support will be quite negative.
After an 8 year bull market we’re becoming increasingly concerned about equity valuations over the next 3 to 12 month. There are concerning signs in markets and these are starting to show up in the charts.
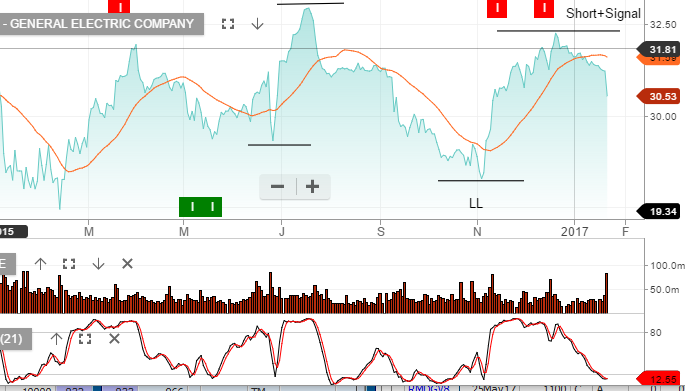
Many large-cap US stocks are showing a “rolling-over” style technical pattern. Following GE’s earnings result last week, along with recent Chinese export data, we’re getting a sense that risks are building.
We’ve used the recent rally in banks as an opportunity to take profits and re balance portfolio’s towards defensive names. We’re also adding short exposure through index ETF’s over the XJO and S&P500.
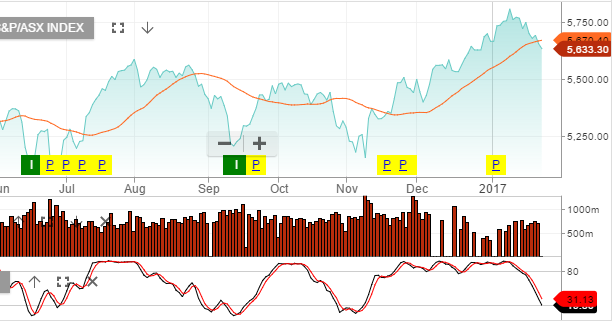
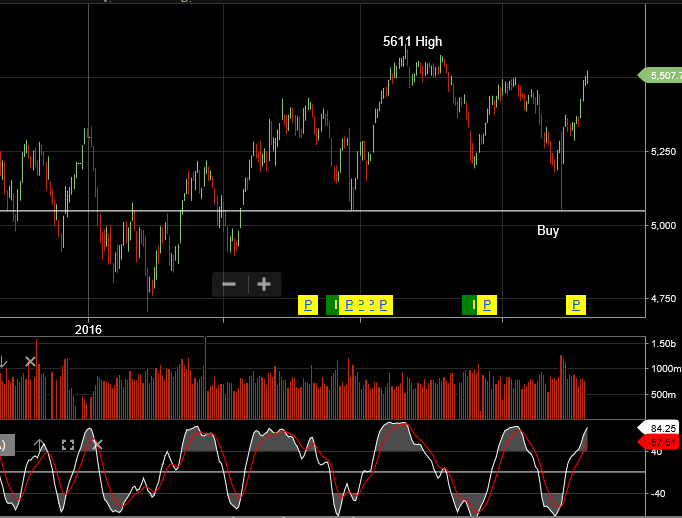
The XJO (ASX200) and the XLF (ASX top 50) continue to trend higher following the breakout which began in early December. We’re now up around 5% from the December low and we’re up over 20% from the 2016 low formed in January.
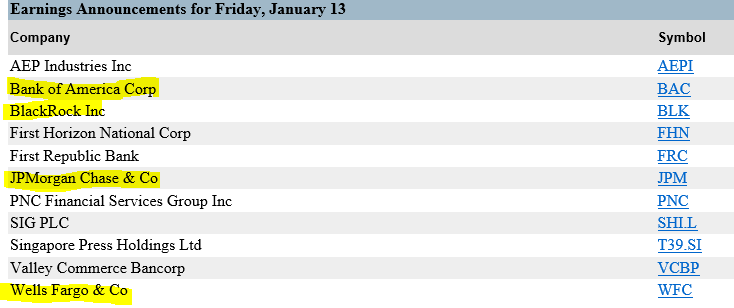
The XJO is trading 17.5x forward earnings on a 4% yield. Our focus will soon shift towards the upcoming US earnings which begin later this week.
Chart – XFL (ASX top 50)Chart – XJO (ASX top 200)Table – US Earnings
After several weeks of following US and European economic reports, Australian investors will get the chance to see how the domestic economy is performing into the end of the year.
This week’s key data points include Building Approvals and New Home Sales on Wednesday, then the quarterly CAPEX reading on Thursday, followed by the Monthly Retails Sales data on Friday.
The Building and New Home sales data have been steady over the last six months and have not offered any surprises which the RBA have had to respond. This week’s data is expected to show that building approvals have bounced back from last month’s 8.7% decline and the sales of new homes is in the 3% range.
The CAPEX and Retail Sales data are a different story. These two data points have been diverging over the last 12 months. Friday’s retail sales report is called .3% higher, which would be the third consecutive monthly increase. On the other hand, the quarterly CAPEX data is expected to show a 2.8% decline reflect the third consecutive quarter of weaker Capital Outlays and the 7th quarter of the last 8 quarters.
From an interest rate policy perspective, the CAPEX data has the greatest potential to move the market.
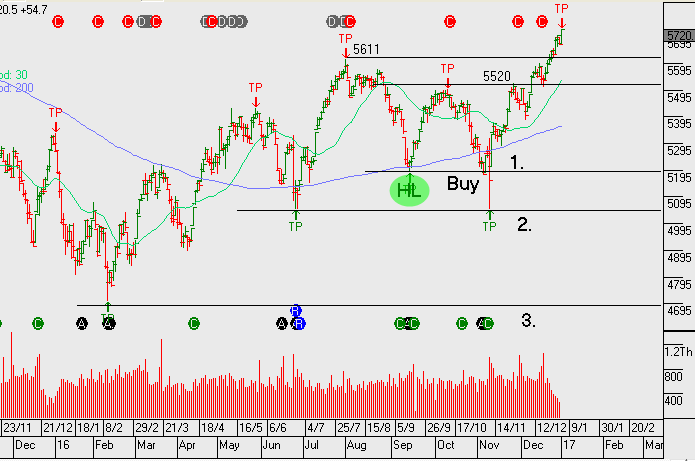
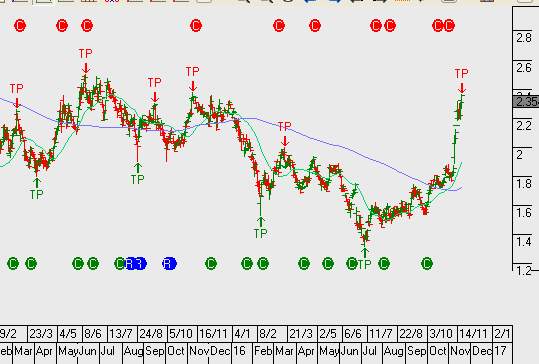
Our algo engine is flagging the lower high technical structure in the ASX 200 index (XJO) and a number of the stocks making up the index are also displaying a similar set up. The resources are the driving force behind the index rally and any attempt to short the market or the index needs to be built upon a view that the big cap resources have exhausted their current rally.
Whilst we’re watching the above and looking for further confirmation, we’re not quite there with regards to changing our existing “long market bias”.
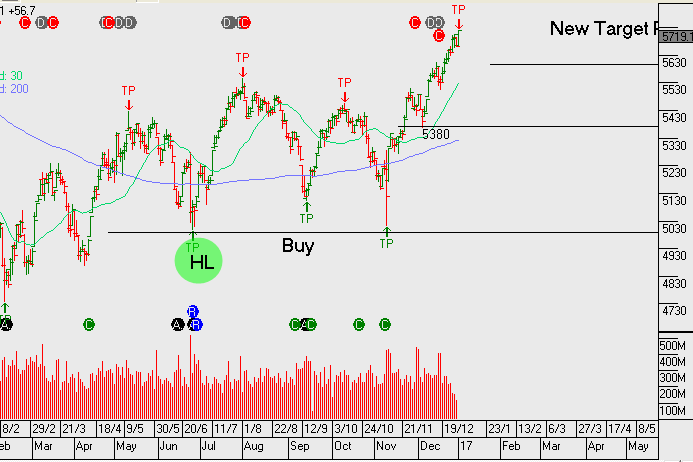
The following chart of the XJO shows the index approaching the previous high of 5611 points (set on 1/8/16). The momentum indicators still remain positive at this stage.
Federal Reserve Chief Janet Yellen was on Capitol Hill today addressing Congress for the first time since the US Presidential election. With the USD Index pushing against a 13-year high over 101.00, it was reasonable to expect some of her testimony to address the stronger USD and the sharp increase in Treasury yields. However, these specific developments weren’t addressed and, instead, Ms Yellen expressed confidence in the progress the economy is making towards their inflation and employment goals.
She indicated that waiting too long would force the FED to tighten faster in 2017 and could spur excess volatility in financial markets, but gave no indication about the pace of interest rate normalisation going forward. On balance, her comments were hawkish enough to keep the G-7 basket of currencies under pressure against the USD, but tempered enough to lift the DOW Jones 30 and SP 500 back up into historic high closing territory.
The economic data released supported this view with housing starts and building approvals rising sharply and weekly jobless claims falling to a 40-year low at 235,000. With three other FED Governors scheduled to speak today, we could see further confirmation that US rate policy is ready to adjust higher.
With all of the bullish USD data stacking up, it’s no surprise that the EUR/USD made a new low for the year, fell for the 9th consecutive day and posted a NY close below 1.0650. It’s worth noting that only once in its 17-year lifetime has the EUR/USD gone down 9 days days in a row. That was from August 28th to September 11th, 2008 when the pair dropped for 11 days in a row and lost close to 10 big figures from 1.4810 to 1.3880. The Euro also lost more ground against the Sterling, reaching a 7-week low of .8540, which is more than 11.5 big figures below the spike high of .9695 on October 6th.
With the Fed Funds futures now showing a 98% chance of a rate hike in December, we expect the chatter from the FED Governors to remain hawkish about the December hike but somewhat blithe about the dot plots and interest rate trajectory going into 2017. It was the markets’s expectation of 4 rate hikes in 2016 which roiled global equity markets earlier this year, and it’s unlikely that the voting FOMC members will want to repeat that level of market dysfunction.
With this in mind, we expect the USD to maintain an upward bias, but with a slower pace, and for US Stock indexes to probe higher and beyond recent resistance levels.
Following last night’s decision in the US to leave rates unchanged, yield stocks will begin their recovery as we forecasted. See our list of stocks and entry levels from the post dated the 2nd September for further details on specific holdings.
Our base case is for the market to remain stable and quality oversold names will revert back to higher price levels . In addition, our strategy includes earning income from companies with limited but stable earnings growth using covered calls.
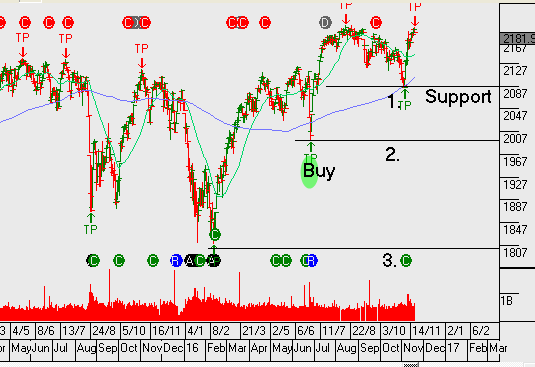
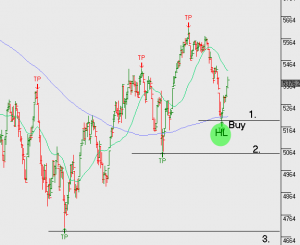
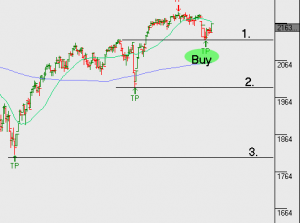
Below, I’ve identified key technical levels to watch in both the XJO and the S&P500 as a mechanism for remaining long the market with a bias toward buy side opportunities. Should the indexes reverse and trade below these levels, we shift our thinking to a more balanced view and begin identifying short trades to help balance the risk in client portfolios.
I’ve used simple numbering 1, 2 & 3, (in charts below), to identify the key breakdown levels that warrant a shift in strategy. To recap, we remain almost exclusively exposed to long positions, with a balanced allocation across asset classes, and hold around 20 preferred names within the ASX top 50 index. In some cases we’ve allowed 5 – 10% capital growth in certain names over coming months. In other names we’ve sold tight covered calls to maximise the income from dividends and call option income.
If the market reverses through the first of our levels, (indicated by 1), we will start shifting our focus to short signals identified by our algorithm engines; which will then start to neutralise the long portfolio bias. When and if this happens, I’ll update you via the blog, otherwise, we continue to hold our “buy on the dip” position.
For more details you may wish to revisit the monthly strategy video posted earlier this week.
S&P ASX 200 finished the week to Friday up 3.8%. The best performer was the Financials ex-Property sector + 5.8%. Worst performer was the Utilities sector up 0.9%
The S&P/ASX 200 Index (XJO.ASX) finished the week down 0.3%. Materials sector showed buying interest with a rally of over 2.8% for the week, whilst financials lagged with the Financials ex-Property down 2.4%.
The best performer was the Materials sector + 5.4%. Fortescue Metals Group FMG.ASX outperformed rising 11.0%. Information Technology lagged, weighed down Computershare Ltd selling off over 6%.
As a reminder CPU was one of our short trade recommendations, to read more on CPU, click the “tags” section in the right column.
Send our ASX Research to your Inbox
Or start a free thirty day trial for our full service, which includes our ASX Research.