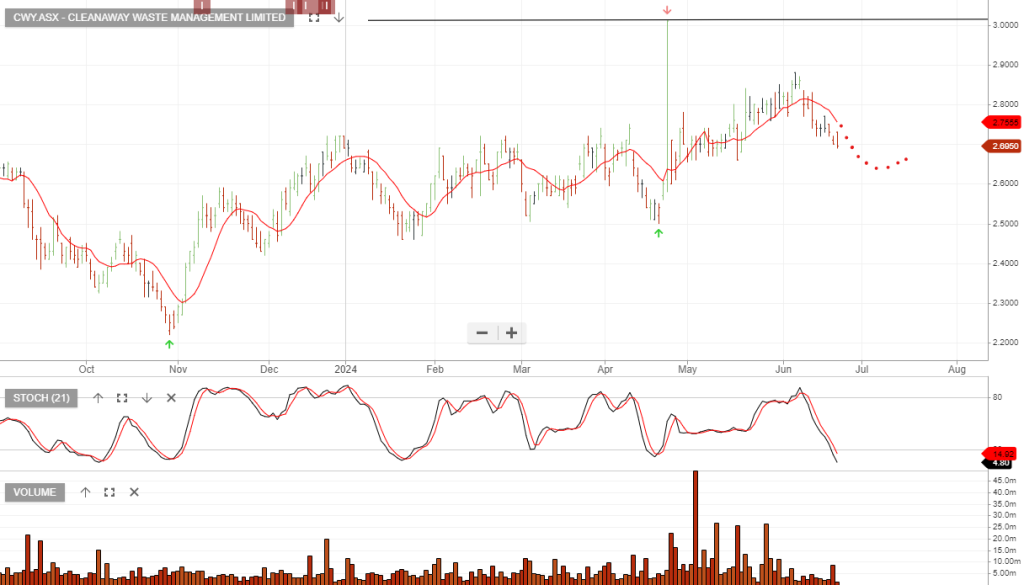
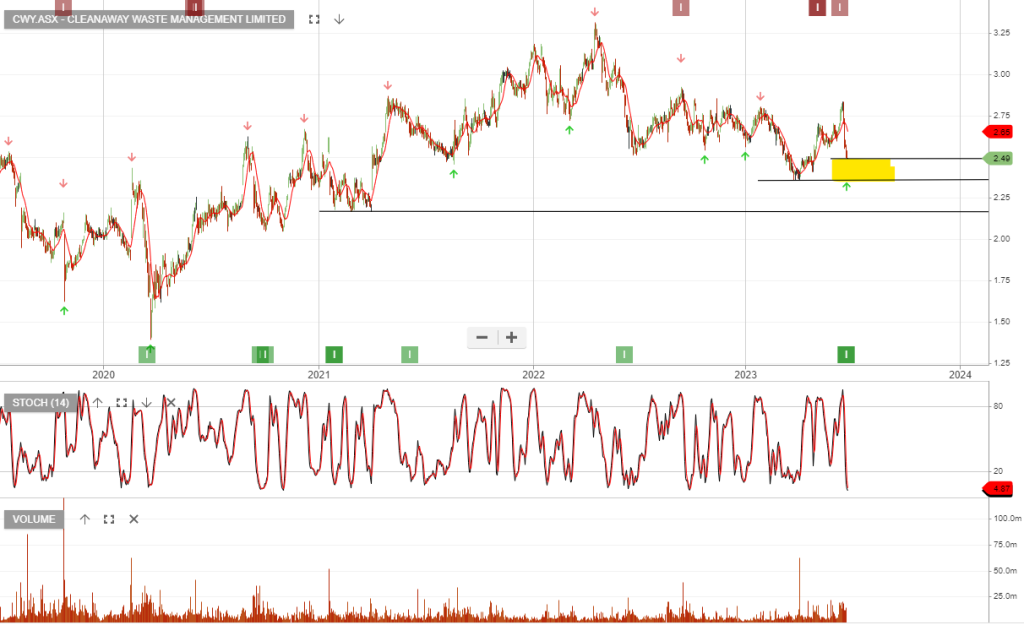
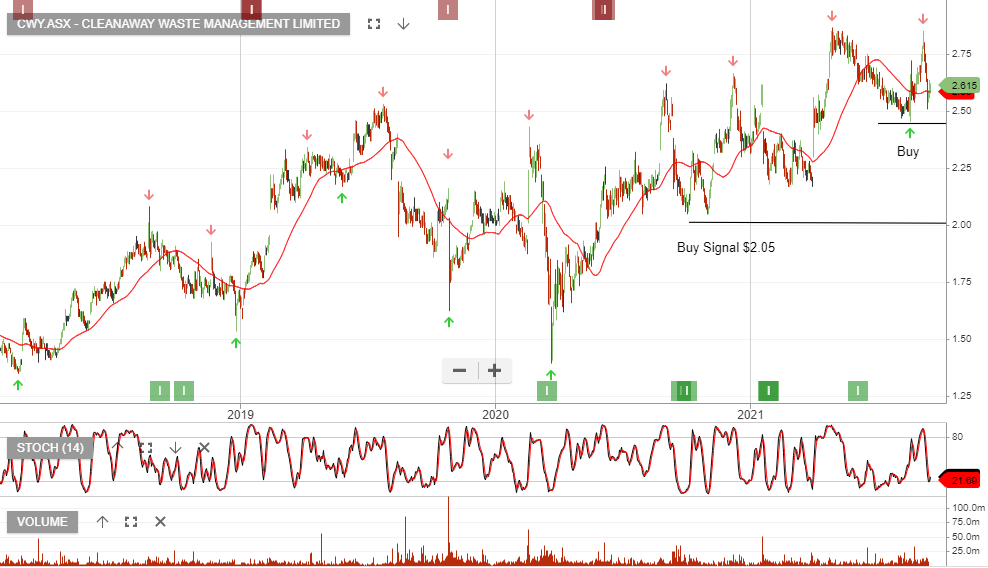
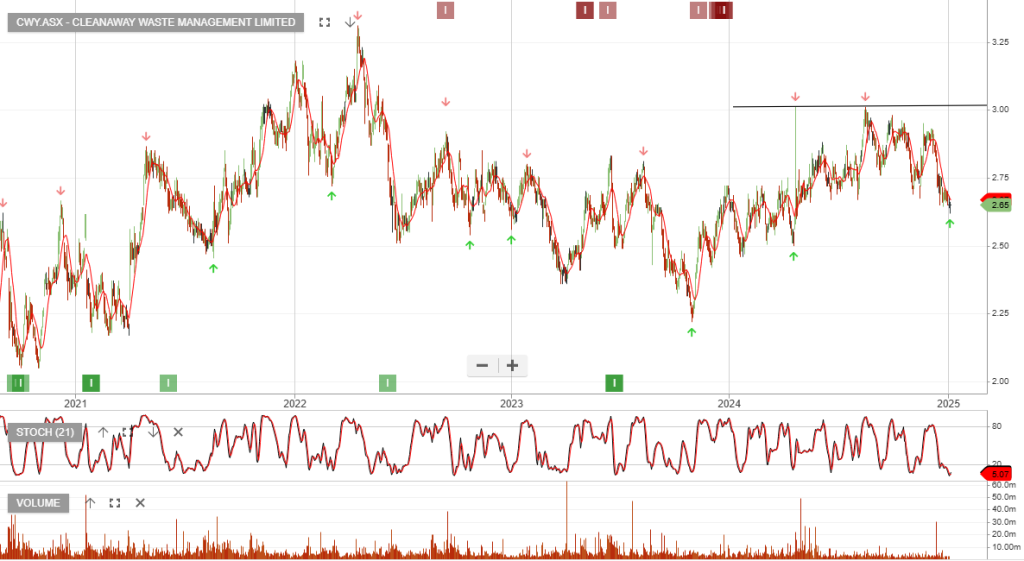
Cleanaway – Buy

Cleanaway Waste Management is under Algo Engine buy conditions and is a current holding in our ASX 100 model portfolio.

Cleanaway financial results for the year ended 30 June 2021

Statutory Net Profit After Tax (NPAT) increased 31.2% from $112.6 million to $147.7 million.

On an Underlying basis compared to the year ended 30 June 2020 (“FY20”) Cleanaway reported:

• NPAT increased 2.1% from $150.0 million to $153.2 million
• EBITDA increased 3.8% from $515.7 million to $535.1 million
• Net revenue increased 4.7% from $2.1 billion to $2.2 billion
• Operating cash flow increased 5.7% from $401.5 million to $424.4 million
• Final dividend increased 11.9% from 2.10 cents per share (cps) to 2.35 cps, taking the total dividend for the year 12.2% higher to 4.60 cps

Update 8/9

Cleanaway – Buy

Cleanaway Waste Management is under Algo Engine buy conditions and is a current holding in our ASX 100 model portfolio.

Cleanaway financial results for the year ended 30 June 2021

Statutory Net Profit After Tax (NPAT) increased 31.2% from $112.6 million to $147.7 million.

On an Underlying basis compared to the year ended 30 June 2020 (“FY20”) Cleanaway reported:

• NPAT increased 2.1% from $150.0 million to $153.2 million
• EBITDA increased 3.8% from $515.7 million to $535.1 million
• Net revenue increased 4.7% from $2.1 billion to $2.2 billion
• Operating cash flow increased 5.7% from $401.5 million to $424.4 million
• Final dividend increased 11.9% from 2.10 cents per share (cps) to 2.35 cps, taking the total dividend for the year 12.2% higher to 4.60 cps