Share Buybacks Underpin US Stocks In August

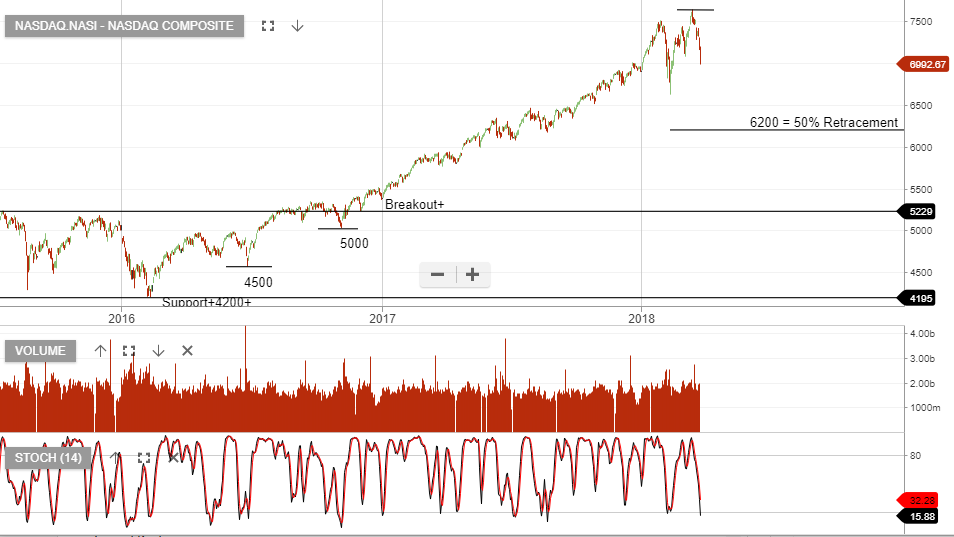
This month was the best August for the NASDAQ index since the Dotcom bubble 18 years ago.

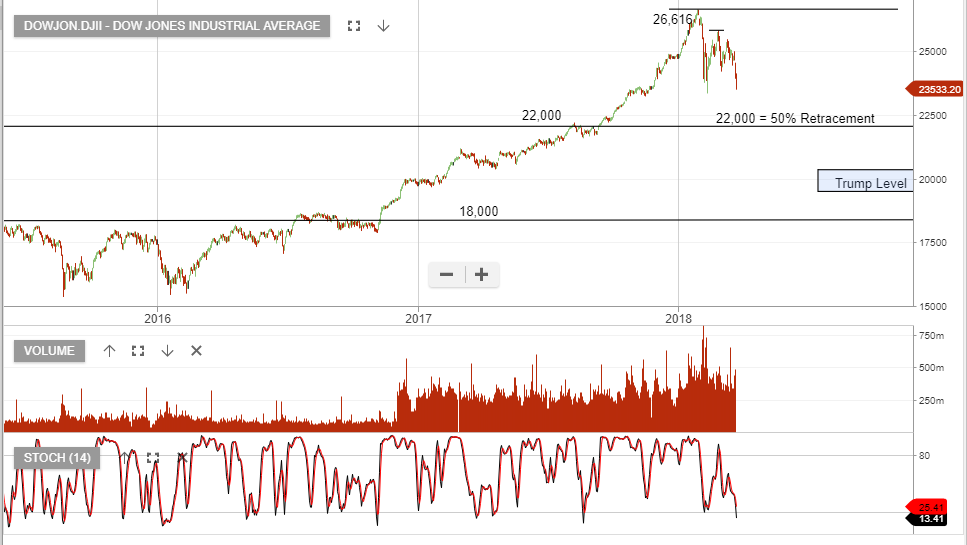
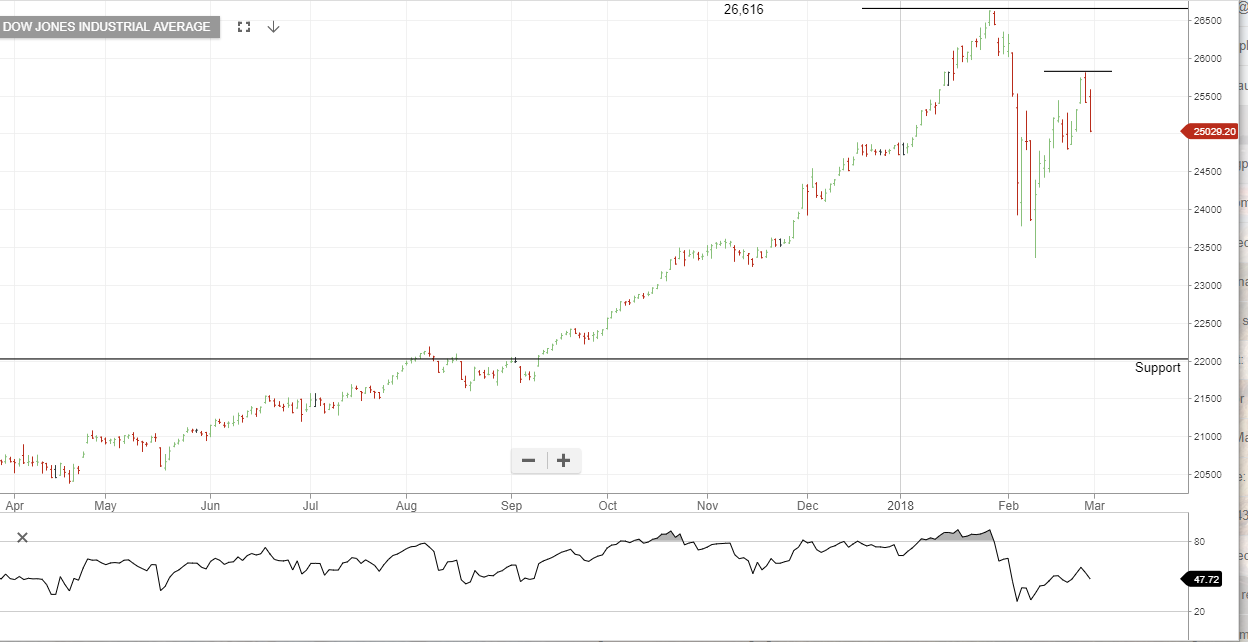
Both the SP 500 and the DOW Jones 30 indexes posted their best August performances since 2014.

More specifically,  Apple shares gained 20% and Amazon shares rose 12.5% during August. Together, these two names accounted for 25% of the entire NASDAQ gain last month.

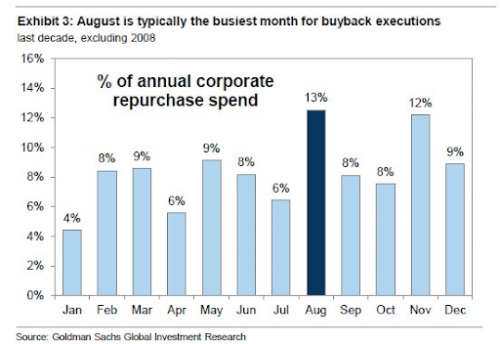
It’s worth noting that share buyback programs for US listed stocks have increased over the last three years and are on track to reach $800 billion this year.

As illustrated in the chart below, August is usually the busiest month of the year for repurchasing stock and the pace drops off during September and October.

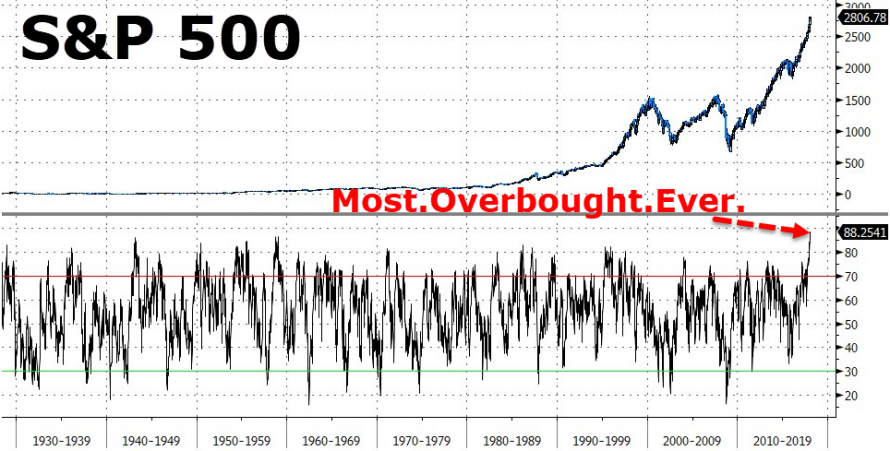
With US stocks at record highs and the local ASX index near a 10-year high, we urge investors to approach the market with caution at the current valuations.

Using our ALGO engine, we employ technical indicators to identify stock specific opportunities across a broad market spectrum during all market conditions .

Give us a call on 1-300-614-002 to discuss our current model portfolio holdings.
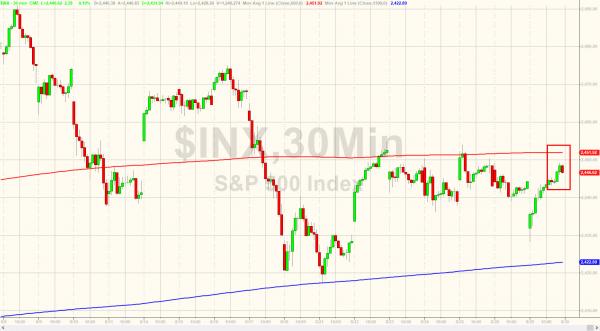
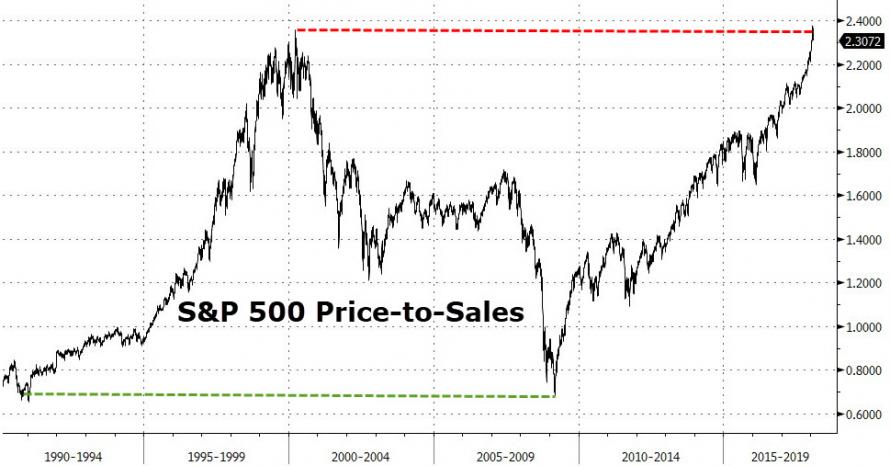


US Equities Build On “Higher Low” pattern

After falling 10% from the January highs, the leading US indices are again exhibiting strong technical momentum, largely supported by bullish earnings outlook and PE expansion for the large technology names.

In Saturday’s post, we looked at the “higher low” formation in the Dow Jones and the need to stay long the index whilst the low of 24,247 remains in place.

We now include an up trending support line and re-affirm  the long side positioning, with a trailing stop loss below the up trending support.

Dow Jones


Dow Jones falls 11.6% – Where is support?

The Dow Jones Index dropped 724 points on Thursday and another 425 points in the overnight session to close at 23,533.

The benchmark index has now declined more than 3,000 points, or 11.6% from its high on Jan 26th, at 26,616.

We’ve been warning about the stretched PE valuations in US markets and we forecast further selling in the tech-heavy NASDAQ, which will drag markets lower.

The Dow closed at 19,827 on Inauguration Day, 20th Jan, 2017, which means it has about 3,700 points further to go before the Trump rally gains disappear.

22,000, or a 50% retracement of the breakout rally which began in late 2016, provides a reasonable downside target where buying interest is likely to provide support for the index.

The NASDAQ is 10% above the 50% retracement price target.


Dow Jones Breaks 16-Month Winning Streak

The Dow Jones 30, along with the SP 500, has posted its first monthly loss since October of 2016.

This has been the longest monthly winning streak since 1959.

However, over the last two days, the DOW has lost over 700 points, or 3%.

And while these headlines will get the attention of investors, it’s the technical significance which should have investors concerned.

Both the DOW and SP 500 dipped below their respective 50-day moving averages, which opens up the probability of range extension to the downside.

As illustrated in the chart below, investors should be prepared to employ defensive strategies and take advantage of stock specific opportunities.

Dow Jones 30


US Payroll Data Triggers Wall Street Rout

U.S. stocks fell sharply on Friday after a stronger-than-expected Non-farm payroll report pushed interest rates higher.

The U.S. economy added 200,000 new jobs in January versus expected growth of 180,000. Weekly average earnings rose 2.9% on an annualized basis and the unemployment rate was unchanged at 4.1%.

The Dow 30 index dropped 665.75 points (2.8%) to close at 25,520, which is the index’s sixth-largest points decline ever.

The broad-based SP 500  fell 2.1% and finished at 2,762, with energy as the worst-performing sector.

The NASDAQ 100 plunged 1.96% to 7,240 as declines in Apple and Alphabet offset a strong gain in Amazon shares.

The combination of extreme valuations and increased leverage in the market could see US equities extend today’s losses into next week.

We suggest cutting high PE names from portfolios and looking for “stock specific” opportunities on the long side. SP 500 Index


The US Government Is Back Open………….Until February 8th

The US Senate was able to agree on a short-term resolution to allow the Government to reopen until the 8th of February.

The US has not had a properly ratified budget since 2009 and these “stop-gap” agreements are now getting shorter in duration.

The DOW, S&P 500 and the NASDAQ all responded by making new all-time highs.

Interestingly, as illustrated in the charts below, not only are the 2-yr Treasury notes now yielding more than the SP 500 in the last 10 years, but the Index itself is the most overbought in history.

We suggest that the extreme valuations on Wall Street will soften US yields over the medium-term.

As such, we would expect to see buying interest in the ASX yield names such as TCL, SYD and WFD .

Our ALGO engine currently has flagged buy signals in TCL and SYD at $11.70 and $6.80, respectfully.

2-yr versus SP 500 yields

SP 500 Sentiment Oscillator


FOMC Overview

As expected, the US FOMC voted to keep rates unchanged last night but signalled that it still expects one more rate hike before the end of the year.

If that’s the case, then the FED Funds target will have been lifted from .25% to 1.50% in just over 12 months. The “Dot plots” were revised slightly lower from 3.0% to 2.75% by the end of 2019.

The response from US stock indexes was muted, but we expect the combination of higher borrowing costs and the reduction of the FED balance sheet to temper any significant gains in US equities into the end of the year.


FOMC Preview: It’s All About The Balance Sheet

This coming Tuesday and Wednesday, the FOMC will meet to discuss the next move in US monetary policy.

Over the last several months, it’s been well-telegraphed that this meeting will focus on unwinding QE and shrinking their balance sheet. The amounts and the mechanics have already been announced. Now it’s just a matter of announcing a starting date.

US financial markets have been brushing off the Fed and have done the opposite of what the Fed has set out to accomplish.

The Fed wants to tighten US financial conditions. It’s worried about asset prices and that these inflated assets, which are used as collateral by the banks, pose a danger to financial stability.

The FED has mentioned several inflated asset classes by name, including equity prices and commercial real estate, which backs $4 trillion in loans heavily concentrated at regional banks.

The FED has raised rates four times since December 2015, including three times over the past nine months. As the chart below illustrates, the relationship between the DOW Jones Index and the FED’s balance sheet is highly correlated.

As such, the FED’s decision could be a prime driver of US equities next week.

US Labor Day Preview

During yesterday’s Asian session and into the London time frame, investors were anxious about North Korea’s provocative missile launch, the flooding disaster in Texas, and the looming US debt ceiling debate.

However, once the US session opened, investor’s attenton  turned to preparing for the Labor Day long weekend, which marks the end of the Northern Summer.

The NYSE will close early on Friday and will remain closed all day next Monday.

Volume on the Dow Jones 30 was barely 220 million, down 25% from the 3 month rolling average of 310 million per day.

As the chart below illustrates, the SP 500 remains below the 30-day moving average with a downward bias.

S&P 500 Index