Black Monday 2011, Revisited

Just over  six years ago, August the 2nd 2011 to be exact, the US Congress avoided a Sovereign default and finally reached an agreement to raise the US debt ceiling from $14.29 trillion to  $15.77 trillion.

The legislation was called the “Budget Control Act of 2011”, and was signed on the same day by President Barack Obama.

During the negotiations, credit agencies, Moody’s, Fitch and Standard and Poor’s all advised lawmakers that the US AAA credit rating was going to be reviewed regardless of the debt ceiling legislation.

After the market closed on Friday, August 5th, several rating agencies downgraded the US credit rating to AA+ .

This triggered a massive selloff on Monday, August 8th,  where The NASDAQ Composite Index fell 174.72 points (-6.90%), the SP 500 Index shed 79.92 points (-6.66%), and the Dow Jones 30 Index lost 634.76 points (-5.55%).

The aggregate loss on the day was over $1 trillion.

As the chart below illustrates, the fall out from the 2011 debt ceiling crisis led to the SP 500 losing 208 points, or 16.1% in just 6 trading days.

The US Congress and the White House have already commenced discussions about raising the debt limit from the current level of $19.80 trillion, with a September 29th deadline.

Considering the market’s inflated valuations based on tax cuts and infrastructure spending, domestic issues with consumer credit and autos loans, and the escalation of geopolitical risks, we suggest caution that this time the US equity market sell off could be much greater.
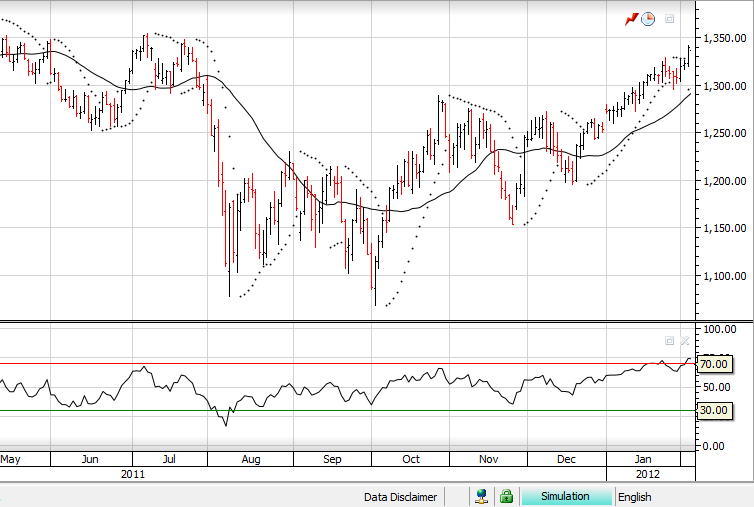
 

SP 500 August 2011.
 

ETF UPDATE: When Will BBUS Take Off Again?

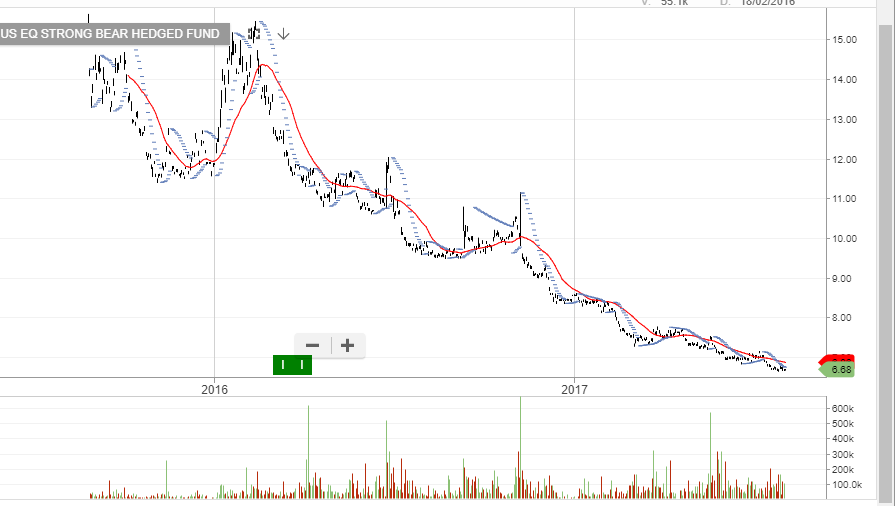
Since December of 2105, there have been three distinct periods of high volatility in the SP 500 which triggered sharp rallies in the BetaShare ETF with the symbol: BBUS.

BBUS is an inverse ETF, which means the share price will rise when the SP 500 trades lower. It’s also weighted, which means that a 1% move in the SP 500 Index will correspond to a 2.5% move in share price.

From December 17th, 2015 to January 19th, 2016, the SP 500 fell from 2077.50 to 1856.25.

This 10% sell off pushed the price of BBUS from $11.85 to $15.20, roughly a 28% gain.

As the chart below illustrates, over the course of 2016 there were two other periods when the BBUS saw  sharp moves higher of over 15%.

BBUS

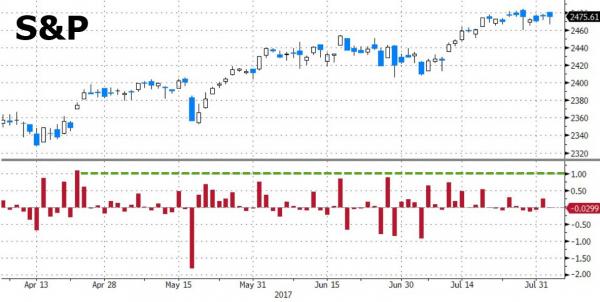
The general point is that the listless drift continues for the SP 500, which hasn’t gained 1% or more in a single day for the last 70 trading sessions, the longest streak since 2007.

The price of BBUS is currently $6.70.


Dow Hits All-Time High As “Short Interest” Drops To A 10-Year Low

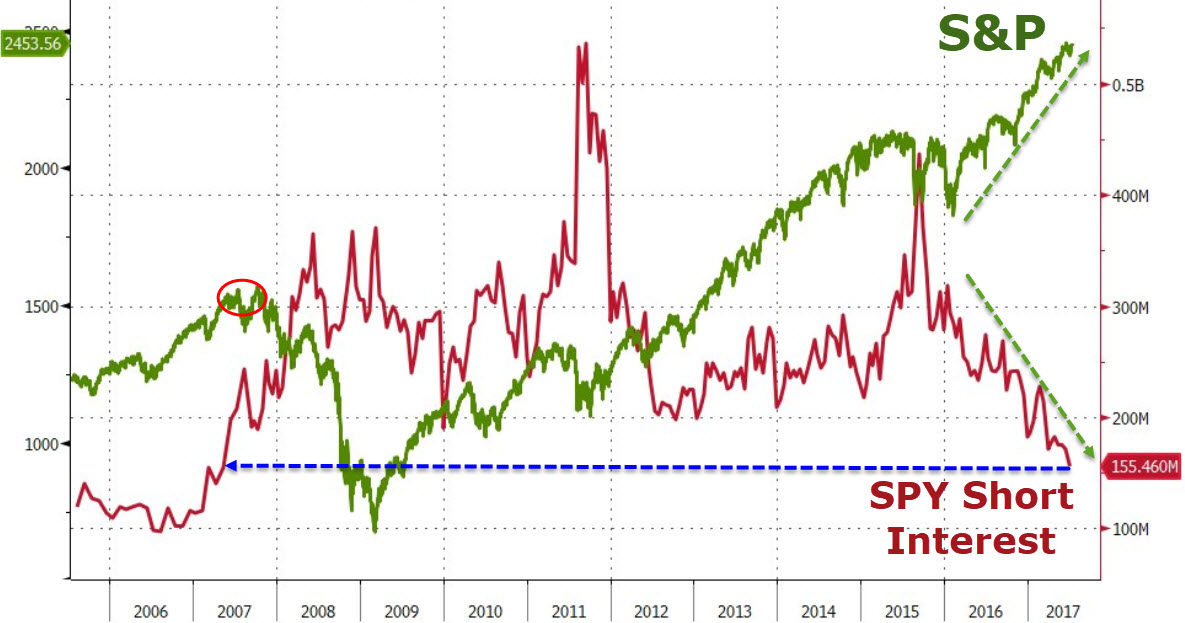
As both the Dow Jones 30 and the S&P 500 rose to new all-time highs this week, daily trading volume was 20% lower than the 3-month average and “short interest” in stocks fell to the 2007 lows.

Short interest is defined as the total Dollar value of stocks which investors have “sold short”, which they don’t own, with the idea of making a profit after buying them back at a lower price.

The combination of seeing the Dow and SP 500 rise to new highs on lower volume, and contracting short interest, is an illustration of a technical “short covering” rally.

Seeing index prices at new highs on lower volume suggests that “new money” is not coming into the market and that stock prices will revert lower after “short sellers” have taken their losses.

This technical combination doesn’t always trigger an immediate sell off in stocks. However, the market condition of “higher highs on lower volume” is often cited after a material correction in the market occurs.

As US earnings season goes into full swing next week, we’ll continue to watch the price/volume correlation and the potential impact on the market.


US Update: Divergence In Market Breadth

As the SP 500 continues to trade near all-time highs, market analysts are reviewing various metrics to determine whether US Stock prices have more upside, or if they are ready for a downside correction.

One of these metrics is “Market Breadth.” Market breadth is a technique used to gauge the direction of the market by measuring the number of stocks trading higher versus the number of stocks moving lower

“Positive” breadth occurs when more stocks are moving higher than lower and vice versa for “negative” breadth.

The breadth numbers are used to determine whether the market has positive momentum or negative momentum.

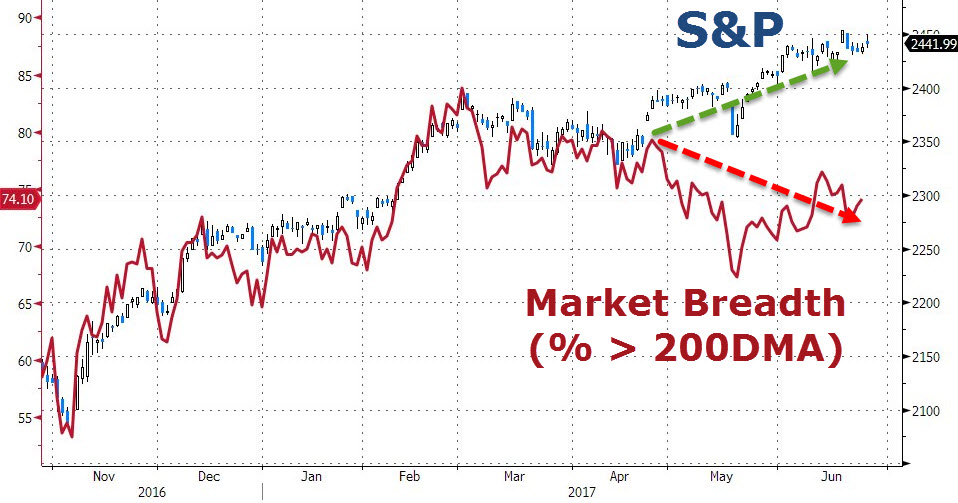
The chart below shows that the SP 500 and market breadth have been diverging since late-April.

To put this divergence into perspective, as of last Friday, nearly 40% of SP 500 stocks were trading below their 200-day moving averages. In addition, 6% of the stocks listed on the NYSE hit new 52-week lows last week.

We will watch these measures closely to see if the current market pricing is resolved to the upside, or if the US Indexes commence a correction lower.

SP 500 vs Market Breadth


ETF Watch – IVV (S&P500)

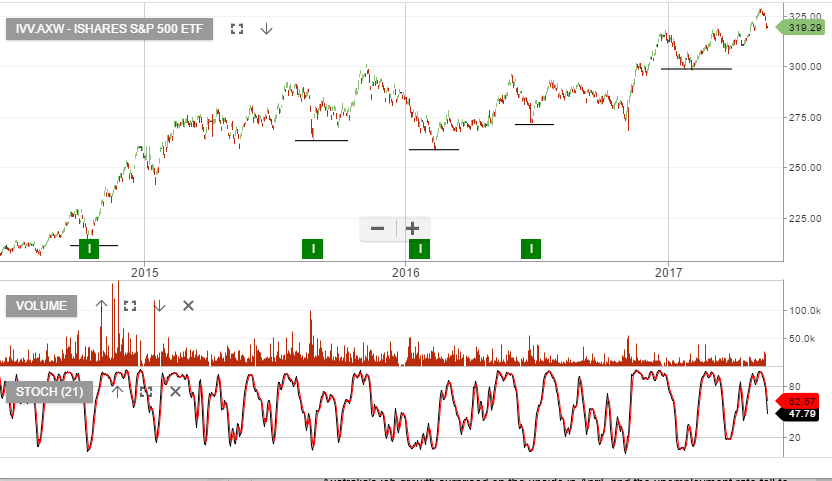
The IVV is an iShares ASX listed ETF that provides exposure to the S&P500 index of stocks.

Our Algo Engine has triggered multiple buy signals over the past 3 years and so far, no sell signals. However, with the index at 18x earnings and deteriorating global economic data, we feel now is an opportunity to lock-in gains and wait for the next Algo Engine buy signal.

Chart – IVV


Crunch Time For US Earnings

US earnings season will go into full swing next week with several DOW components and high-capitalization  S&P 500 companies reporting Q1 earnings.

Thus far, the results have been mixed with IBM missing badly and forward guidance on the major US banks showing concerns for future revenue growth.

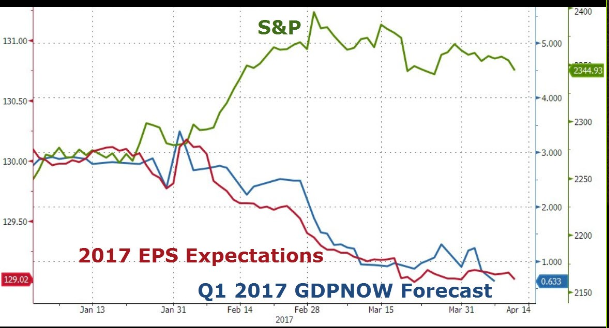
The chart below shows that the expectations of S&P earnings, relative to the current pricing of the S&P 500 index, are very much out of line.

If next week’s earnings reports don’t exceed expectations, we could see further downside range extension on the SP 500 index, which could pressure the XJO index lower.

We have been looking at the May 5800 XJO puts as a short-term portfolio hedging instrument for a move lower in the local market.

We have also been buying the BetaShare BBOZ inverse exchange traded fund. Shares in BBOZ gain value as the local market trades lower.

US Payroll Preview

The US Non-Farm Payroll data will be released at the start of today’s NY session. With US Stocks reacting negatively to the news of the FED’s plan to begin reducing their balance sheet, attention will be focused on the interest rate aspect of the report.

The consensus headline number is expected at 174,000 new jobs with Hourly Earnings expected to climb by .2%.

The cause and effect logic to the data will be that a stronger report would be negative for stocks, since it would support the odds of another rate hike in June.

Both the DOW 30 and SP 500 indexes are trading below their 30-day moving averages and could extend lower on stronger data. We see downside support at 20,300 and 2315, respectfully.

A large miss in the data would likely lift US stocks on the notion that the FED will remain on hold until August.

US Stocks Reverse Lower On FED Comments

US stocks ended lower on the day after a sharp, mid-session reversal was triggered by comments from the US Federal Reserve.

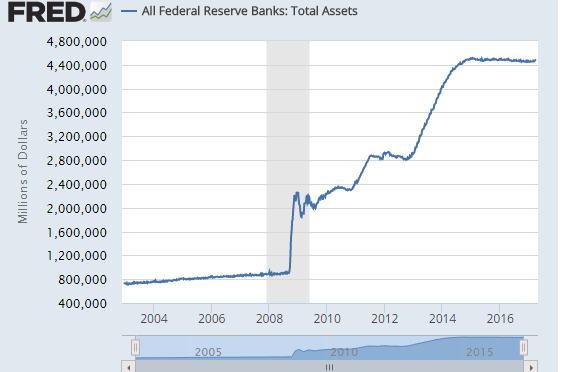
It was reported that during the last FED meeting, when rates were lifted by 25 basis points, some voting members viewed US equity prices as “quite high relative to standard valuation measures” and that the central bank should take steps to begin trimming its $4.5 Trillion balance sheet.

The DOW 30 posted its largest intra-day downside reversal in 14 months. After an early gain of almost 200 points, the DOW closed down 41 points and near the session low.

Volume was very heavy at 7.5 billion shares compared to the average volume of 6.5 Billion shares over the last month.

It’s worth noting that the process of reducing the balance sheet acts as an accelerator to tightening monetary conditions and is generally not bullish in an over valued market.

FED Balance Sheet

Heavy Losses On Wall Street

Both the DOW Jones 30 and SP 500 index fell over 1% today during the worst trading session for 2017 for US Blue-Chip stocks.

Banking names led the hefty losses, with the DJ Banking Index trading back below the 50-day moving average.

Dow/SP component Goldman Sachs lost almost $10.00 on the day and is now 10% lower than the March 1st close of $253.00.

A confluence of lower loan growth, political uncertainty and extended valuations pressured the banks, as well as the general market, lower on very high trading volume.

Technically, both the DOW Jones and the SP 500 have posted their first close below the 30-day moving average since November 7th.

The unwinding of the overbought conditions in many of the index components will likely be a process more than an event.

With the banking sector very heavily weighted in the ASX 100, this process will likely pressure Australian names lower, as well.

Investors who are looking to hedge their portfolios or profit from a down move in the ASX can trade either the BetaShare  BBOZ  or BEAR Exchange Traded Funds.

These are inverse funds which gain value as the ASX index trade lower. Please call for more information.

Mixed Payroll Data Lifts The Dow

US January Non-Farm Payrolls increased 227,000, which was well above consensus expectations of around 175,000.

The December revision was little changed at 157,000 from the 156,000 reported last month and the three-month average increased to 183,000 from 148,000 previously.

Unemployment rose to 4.8% from 4.7% the previous month and compared with expectations of an unchanged rate on the month.

Average earnings rose 0.1% for the month and this was well below consensus forecasts for a 0.3% gain. The December increase in average earnings was also revised down to 0.2% from the originally reported 0.4%.

The annual increase in earnings, therefore, slowed to 2.5% from 2.9% previously and was well below the 2.9% expected rate.

The stronger headline jobs number combined with weaker wages reduced the pressure on the FOMC to raise rates at their March meeting. This is reflected in the Fed Funds futures market where the implied probability of a rate hike fell from 18% prior to the payroll data to 9% by the New York close.

This market sentiment that rates could stay “lower for longer” lifted US Stock Indexes with the Dow and SP 500 gaining just under 1% for the day and the NASDAQ adding just over .50%

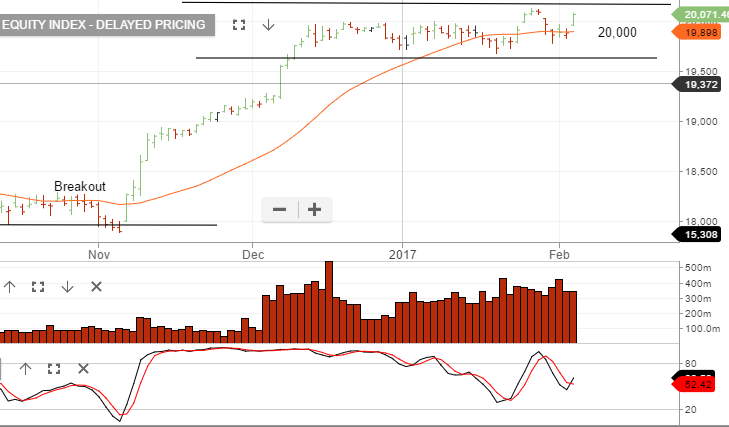
Chart – Dow Jones